For those of you who are writing on the influence of Islam on the prospects for democratization in predominantly Muslim countries, here is an interesting video, which asks Muslim women about their views on the compatibility of Islam with women’s rights and democracy. This is a nice complement to the Fish article that we read two weeks ago. Here is an illuminating quote from one of the women interviewed in the film:
“First of all I didn’t understand why my brother didn’t have to do housework and I have to do housework…as a little girl it did not make sense to me. Just because he’s a boy he doesn’t have to do housework?!? So for me the questioning was from the family, but the family never used religion to justify why [boys didn’t have to do housework], so I always knew it was culture and tradition.”
“We wanted to break the monopoly, that only the lama, only the religious authorities, have the right to talk about Islam and define what is Islam and what is not Islam.”
Zainah Anwar
Co-founder, Sisters in Islam
Kuala Lumpur, Malaysia
Here is the very interesting video, which is about 26 minutes long. Throughout this film many of the concepts that we have learned this semester are brought into play.
In IS210 today, we viewed a short clip from this interesting lecture by Professor Joseph Chan given at Cornell University. Professor Chan of the University of Hong Kong talks about the shared moral basis of contemporary Chinese society. With Leninism/Marxism/Maoism being discredited amongst most Chinese, the search begins for a new moral basis/foundation for society.
As Professor Dick Miller says in his introductory remarks:
In China, as in the United States, people feel a great need for an adequate, shared, ethical basis for public life. There, as here, people don’t think that freedom to get as rich as you can is an adequate basis.
So, what is that basis, if the official ruling ideology of the political regime no longer seems legitimate. Liberal democracy? Confucianism. There are adherents in China of both of these as the proper ethical foundation. What does Professor Chan have to say about the compatibility of Confucian ideals with democracy? Watch and find out. It’s a very informative lecture.
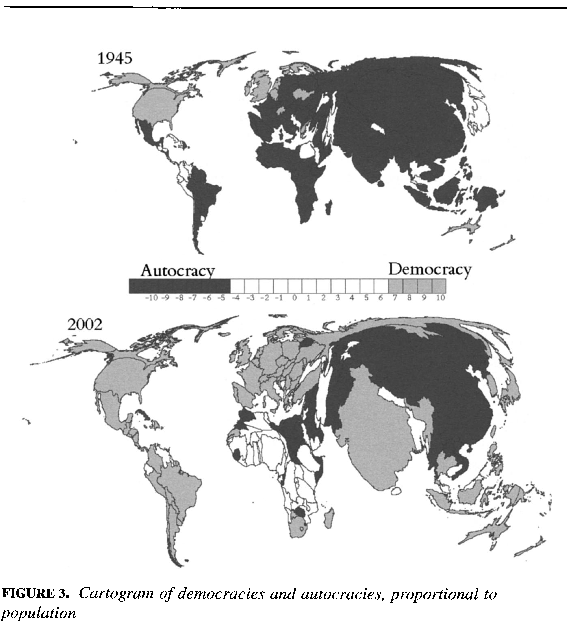
One of the empirical facts of the post-WWII era has been the inexorable rise not only in the number of democratic states, but also in the number of the world’s denizens who reside in democracies. We’ve probably all seen the Freedom House world Maps of Freedom, which are published on an annual basis.
That’s great for providing a quick visual idea of how many of the world’s states have democratic regimes. But, it doesn’t tell us how many of the world’s inhabitants live in democracies. This clever cartogram by Gleditsch and Ward does this. Cartograms bend and mis-shape world maps on the basis of the values of the underlying variable–in this case, population. What do you think? The map below shows a dramatic rise since 1945 in both the number of states and the number of the world’s citizens who live in democracies. You’ll note that this map is from 2002 data, and there have been some important changes, notably Russia’s slide back toward autocracy in the last decade or so. Also, look at how massive India and China are (population-wise)!
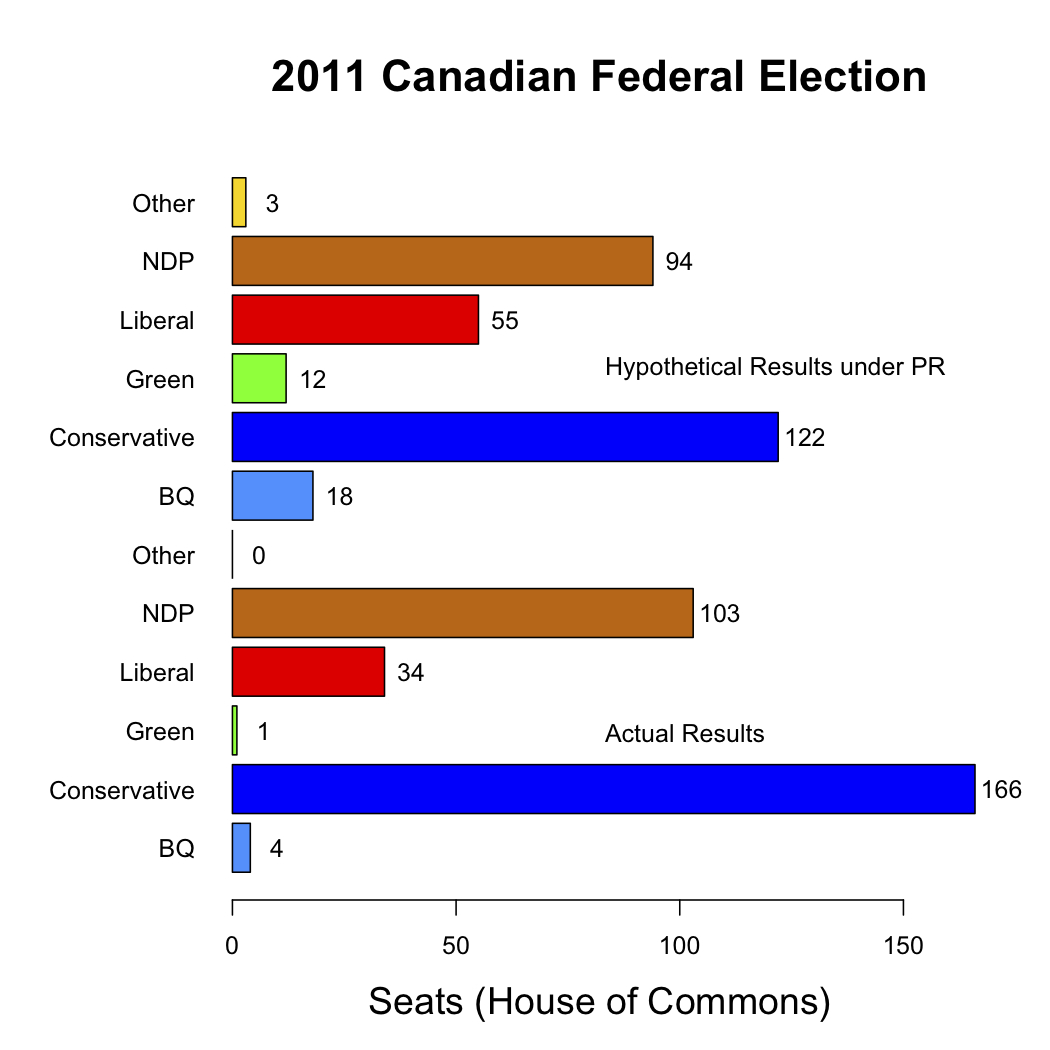
In IS210 we will discuss the relative merits of the two most frequently instituted electoral systems–proportional representation and plurality (also called majority or “first-past-the-post” electoral systems.
In advance, here is a chart that I’ve created, which shows the electoral results (in terms of number of seats won in the House of Commons) of the 2011 Canadian Federal election. The bottom of the chart contains the actual number of seats won, while the top lists the hypothetical number of seats each party would have won if Canada’s electoral system were one of proportional representation. So, Canada’s electoral system is working as it should, correct?
In conjunction with this week’s readings on democracy and democratization, here is an informative video of a lecture given by Ellen Lust of Yale University. In her lecture, Professor Lust discuses new research that comparative analyzes the respective obstacles to democratization of Libya, Tunisia, and Egypt. For those of you in my IS240 class, it will demonstrate to you how survey analysis can help scholars find answers to the questions they seek. For those in IS210, this is a useful demonstration in comparing across countries. [If the “start at” command wasn’t successful, you should forward the video to the 9:00 mark; that’s where Lust begins her lecture.]
In a recent working paper by Hanson and Sigman, of the Maxwell School of Citizenship and Public Affairs at Syracuse University, the authors explore the concept(s) of state capacity. The paper title–Leviathan’s Latent Dimensions: Measuring State Capacity for Comparative Political Research, complies with my tongue-in-cheek rule about the names of social scientific papers. Hanson and Sigman use statistical methods (specifically, latent variable analysis) to tease out the important dimensions of state capacity. Using a series of indexes created by a variety of scholars, organizations, and think tanks, the authors conclude that there are three distinct dimensions of state capacity, which they label i) extractive, ii) coercive, and iii) administrative state capacity.
Here is an excerpt:
The meaning of state capacity varies considerably across political science research. Further complications arise from an abundance of terms that refer to closely related attributes of states: state strength or power, state fragility or failure, infrastructural power, institutional capacity, political capacity, quality of government or governance, and the rule of law. In practice, even when there is clear distinction at the conceptual level, data limitations frequently lead researchers to use the same
empirical measures for differing concepts.
For both theoretical and practical reasons we argue that a minimalist approach to capture the essence of the concept is the most effective way to define and measure state capacity for use in a wide range of research. As a starting point, we define state capacity broadly as the ability of state institutions to effectively implement official goals (Sikkink, 1991). This definition avoids normative conceptions about what the state ought to do or how it ought to do it. Instead, we adhere to the notion that capable states may regulate economic and social life in different ways, and may achieve these goals through varying relationships with social groups…
…We thus concentrate on three dimensions of state capacity that are minimally necessary to carry out the functions of contemporary states: extractive capacity, coercive capacity, and administrative capacity. These three dimensions, described in more detail below,accord with what Skocpol identifies as providing the “general underpinnings of state capacities” (1985: 16): plentiful resources, administrative-military control of a territory, and loyal and skilled officials.
Here is a chart that measures a slew of countries on the extractive capacity dimension in
Those of you in my IS210 class may find the Polity IV data to be of use when writing your paper. Click on the image below to take you to the website, where (if you scroll down to the bottom) you can see the regime scores (between -10 and +10) for each country over many years. See the example at the bottom of this post.
Political Regime Types–Polity IV Dataset
Here’s an exampe of the history of movements in regime for El Salvador from 1946 until 2010. How many changes in regime does El Salvador seem to have experienced in the post-WWII period? What happened in the early 1980s?
In IS210, we will be reading about domestic political economy next week. Understanding the role of state and market, politics and economics, we can learn about what causes some countries’s economies to grow quite rapidly and other countries’ economies to grow more slowly. We’ll look at the role of domestic institutions and policy choices as key root causes in economic development. [How does this contrast with Inglehart’s arguments, or Weber’s idea of the ‘Protestant work ethic?’] Increasingly, though, our ever more globalized and interdependent world economy provides domestic economies with opportunities and threats that didn’t exist to nearly this extent even 50 years ago. We’ll look at economist N. Gregory Mankiw’s New York Times editorial piece on the “trilemma of international finance.”
Have a look at this Frontline excerpt on the Asian financial crisis of 1997 and the role that fixed exchange rates played:
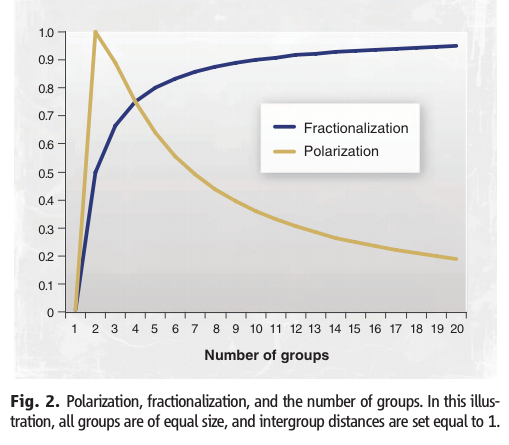
In a series of recent articles, civil conflict researchers Esteban, Mayoral, and Ray (see this paper for an example) have tried to answer that question. Is it economic inequality, or cultural differences? Or maybe there is a political cause at its root. I encourage you to read the paper and to have a look at the video below. Here are a couple of images from the linked paper, which you’ll see remind you of concepts that we’ve covered in IS210 this semester. The first image is only part of the “Model of Civil Conflict.” Take a look at the paper if you want to see the “punchline.”
Here is the relationship between fractionalization and polarization. What does each of these measures of diversity measure?
And here’s a nice youtube video wherein the authors explain their theory.
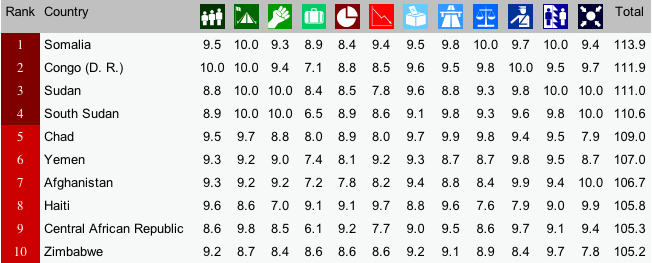
The Failed State Index is created and updated by the Fund for Peace. For the most recent year (2013), the Index finds the same cast of “failed” characters as previous years. There is some movement, the “top” 10 has not changed much over the last few years.
The Top 10 of the Failed States Index for 2013
Notice the columns in the image above. Each of these columns is a different indicator of “state-failedness”. If you go to the link above, you can hover over each of the thumbnails to find out what each indicator measures. For, example, the column with what looks like a 3-member family is the score for “Mounting Demographic Pressures”, etc. What is most interesting about the individual indicator scores is how similar they are for each state. In other words, if you know Country X’s score on Mounting Demographic Pressures, you would be able to predict the scores of the other 11 indicators with high accuracy. How high? We’ll just run a simple regression analysis, which we’ll do in IS240 later this semester.
For now, though, I was curious as to how closely each indicator was correlated with the total score. Rather than run regression analyses, I chose (for now) to simply plot the associations. [To be fair, one would want to plot each indicator not against the total but against the total less that indicator, since each indicator comprises a portion (1/12, I suppose) of the total score. In the end, the general results are similar,if not exactly the same.]
So, what does this look like? See the image below (the R code is provided below, for those of you in IS240 who would like to replicate this.)
Plotting each of the Failed State Index (FSI) Indicators against the Total FSI Score
Here are two questions that you should ponder:
If you didn’t have the resources and had to choose only one indicator as a measure of “failed-stateness”, which indicator would you choose? Which would you definitely not choose?
Would you go to the trouble and expense of collecting all of these indicators? Why or why not?
R-code:
install.packages("gdata") #This package must be installed to import .xls file

library(gdata) #If you find error message--"required package missing", it means that you must install the dependent package as well, using the same procedure.

fsi.df<-read.xls("http://ffp.statesindex.org/library/cfsis1301-fsi-spreadsheet178-public-06a.xls")  #importing the data into R, and creating a data frame named fsi.df

pstack.1<-stack(fsi.df[4:15]) #Stacking the indicator variables in a single variable

pstack.df<-data.frame(fsi.df[3],pstack.1) #setting up the data correctly

names(pstack.df)<-c("Total","Score","Indicator") #Changing names of Variables for presentation

install.packages("lattice")  #to be able to create lattice plots

library(lattice) #to load the lattice package

xyplot(pstack.df$Total~pstack.df$Score|pstack.df$Indicator,  groups=pstack.df$Indicator, layout=c(4,3),xlab="FSI Individual Indicator Score", ylab="FSI Index Total")


You must be logged in to post a comment.