Field Experiments in the Social Sciences–Health Outcomes

One of the more well-known examples of a field experiment in the social sciences is Esther Duflo’s experiment on the usage of mosquito bed nets. Duflo argues that there has been much debate about the effects and efficiency of aid in less-developed countries.

Regarding the bed nets issue, it is well understood that sleeping under a mosquito bed-net in malaria-ravaged regions greatly decreases the chances of contracting malaria. Bed nets are cheap to make and distribute (about $10 US per net), so it’s a relatively efficient way to prevent people (particularly young children) from dying from one of the world’s most deadly diseases. So, why not just give bed nets to those wanting/needing them? Duflo discusses some reasons for and against. Indeed, there are many good reasons a prior to support both the view that bed nets should be given away and that people should be forced to pay for them. There are other issues as well, which you can learn about from the video.

Randomization in a Field Experiment

For this post, what is most crucial is that prior to Duflo (and her colleagues’) field experiments, there was no empirical evidence as to what the best approach to dealing with the bed-nets issue was. Following these field experiments, we have the first concrete empirical data to adjudicate amongst the approaches. In order to guarantee the internal validity of these experiments, however, the researchers had to be careful about ensuring randomization. Remember, random does not mean haphazard. The word has a specific meaning, which we’ll discuss next week. The image above is a screenshot from Duflo’s TED talk, showing the result (but not the method of) randomization in one experiment. How is randomization important for both internal and external validity?

Indicators and The Failed States Index

The Failed State Index is created and updated by the Fund for Peace. For the most recent year (2013), the Index finds the same cast of “failed” characters as previous years. There is some movement, the “top” 10 has not changed much over the last few years.

The Top 10 of the Failed States Index for 2013

Notice the columns in the image above. Each of these columns is a different indicator of “state-failedness”. If you go to the link above, you can hover over each of the thumbnails to find out what each indicator measures. For, example, the column with what looks like a 3-member family is the score for “Mounting Demographic Pressures”, etc. What is most interesting about the individual indicator scores is how similar they are for each state. In other words, if you know Country X’s score on Mounting Demographic Pressures, you would be able to predict the scores of the other 11 indicators with high accuracy. How high? We’ll just run a simple regression analysis, which we’ll do in IS240 later this semester.

For now, though, I was curious as to how closely each indicator was correlated with the total score. Rather than run regression analyses, I chose (for now) to simply plot the associations. [To be fair, one would want to plot each indicator not against the total but against the total less that indicator, since each indicator comprises a portion (1/12, I suppose) of the total score. In the end, the general results are similar,if not exactly the same.]

So, what does this look like? See the image below (the R code is provided below, for those of you in IS240 who would like to replicate this.)

Plotting each of the Failed State Index (FSI) Indicators against the Total FSI Score

Here are two questions that you should ponder:

  1. If you didn’t have the resources and had to choose only one indicator as a measure of “failed-stateness”, which indicator would you choose? Which would you definitely not choose?
  2. Would you go to the trouble and expense of collecting all of these indicators? Why or why not?

R-code:


install.packages("gdata") #This package must be installed to import .xls file

library(gdata) #If you find error message--"required package missing", it means that you must install the dependent package as well, using the same procedure.

fsi.df<-read.xls("http://ffp.statesindex.org/library/cfsis1301-fsi-spreadsheet178-public-06a.xls")  #importing the data into R, and creating a data frame named fsi.df

pstack.1<-stack(fsi.df[4:15]) #Stacking the indicator variables in a single variable

pstack.df<-data.frame(fsi.df[3],pstack.1) #setting up the data correctly

names(pstack.df)<-c("Total","Score","Indicator") #Changing names of Variables for presentation

install.packages("lattice")  #to be able to create lattice plots

library(lattice) #to load the lattice package

xyplot(pstack.df$Total~pstack.df$Score|pstack.df$Indicator,  groups=pstack.df$Indicator, layout=c(4,3),xlab="FSI Individual Indicator Score", ylab="FSI Index Total")

Deal or no deal and rational choice theory

As my students are aware, I have been under the weather since the beginning of January and am finally feeling somewhat like a human being again. During my down time, I took some rest and had time to do some non-school-related activities, one of which was trying out the Deal or No Deal app on my smartphone. You do remember the TV show hosted by Howie Mandel, right?

Deal or No Deal and Rational Choice Theory

Anyway, the basic idea of the show is this:

  • There are 26 suitcases on state, each with a card containing a dollar amount between $1 and $1 Million.
  • The game begins when the contestant chooses one of the 26 suitcases as “their” suitcase. If the contestant keeps the suitcase until the end of play, they win the dollar amount written on the card inside the suitcase.
  • The contestant must begin opening a certain amount of suitcases during each round of play–5 the first round, 4 the next, etc.
  • After each round, the game pauses and the contestant receives an offer from the mysterious banker via telephone with Howie as the intermediary.
  • The contestant is then asked whether there is a “deal, or no deal.” The contestant may accept the banker’s offer or continue. [There is where the drama gets ramped up to 11!]
  • If you have watched the show, you’ll notice that the banker’s offer depends upon which dollar amounts have been revealed. If the contestant reveals many high-value suitcases, it becomes like likely (probable) that the suitcase s/he chose at the beginning is a high-value suitcase.

The smartphone version is slightly different from the TV show in that the suitcases do not have dollar amounts attached but point multiples (that is, you win 1X, 2X, 3x, etc. 1000X the pot).

Take a look at the images above screenshot (is that the past participle?) from my smartphone. What do you notice about the banker’s offer? What’s of importance here is the red boxes in each picture. These are two separate games, btw.

These are two separate games. In the top game, there are only two suitcases left–one of them is the 20X and the 200X, Therefore, I have either the 20X or the 200X. That’s quite a big difference in winnings–ten times. So, what would you do? What would a rational choice theorist say you should do? Are the bankers offers rational in each case? Why or why not?

Resources for First Paper (IS 210)–Risk Assessment

World Map of The Failed States  Index for 2013
World Map of The Failed States Index for 2013

Here are some data resources that may be helpful to you while researching and writing your first paper assignment.

Clouds, Clocks, and Sitting at Tables

Here are some data resources that may be helpful to you while researching and writing your first paper assignment. I’ll be showing you how to use/access some of these sources in class on Thursday, September 23rd.

View original post 41 more words

Does Segregation lead to interethnic violence or interethnic peace?

That’s an important question, because it not only gives us an indication of the potential to stem inter-ethnic violence in places like Iraq, Myanmar, and South Sudan, but it also provides clues as to where the next “hot spots” of inter-ethnic violence may be. For decades now, scholars have debated the answer to the question. There is empirical evidence to support bot the “yes” and “no” sides. For example, in a recent article in the American Journal of Political Science [which is pay-walled, so access it on campus or through your library’s proxy] Bhavnani et al. list some of this contradictory evidence:

How to create peace between Protestants and Catholics in Belfast? Erect 18-ft high "peace lines"
How to create peace between Protestants and Catholics in Belfast? Erect 18-ft high “peace lines”

Evidence supporting the claim that ethnic rivals should be kept apart:

  • Los Angeles riots of 1992, ethnic diversity was closely associated with rioting (DiPasquale and Glaeser 1998),
  • That same year, Indian cities in Maharashtra, Uttar Pradesh, and Bihar, each of whichhad a history of communal riots, experienced violence principally in locales where the Muslim minority was integrated. In Mumbai, where over a thousand Mus-
    lims were killed in predominantly Hindu localities, the Muslim-dominated neighborhoods of Mahim, Bandra,
    Mohammad Ali Road, and Bhindi Bazaar remained free of violence (Kawaja 2002).
  • Violence between Hindus and Muslims in Ahmedabad in 2002 was found to be significantly higher in ethnically mixed as opposed to segregated neighborhoods (Field et al. 2008).
  • In Baghdad during the mid-2000s, the majority displaced by sectarian fighting resided in neighborhoods where members of the Shi’a and Sunni communities lived in close proximity, such as those on the western side of the city (Bollens2008).

Evidence in support of the view that inter-mixing is good for peace:

  • Race riots in the British cities of Bradford, Oldham, and Burnley during the summer of 2001 were attributed to high levels of segregation (Peach 2007).
  • In Nairobi, residential segregation along racial (K’Akumu and Olima 2007) and class lines (Kingoriah 1980) recurrently produced violence.
  • In cities across Kenya’s Rift Valley, survey evidence points to a correlation between ethnically segregated residential patterns, low levels of trust, and the primacy of ethnic over national identities and violence (Kasara 2012).
  • In Cape Town, following the forced integration of blacks and coloreds by means of allocated public housing in low-income neighborhoods, a “tolerant multiculturalism” emerged (Muyeba and Seekings 2011).
  • Across neighborhoods in Oakland, diversity was negatively associated with violent injury (Berezin 2010).

Scholars have advanced many theories about the link between segregation and inter-ethnic violence (which I won’t discuss right now), but none of them appears to account for all of this empirical evidence. Of course, one might be inclined to argue that segregation is not the real cause of inter-ethnic violence, or that it is but one of many causes and that the role played by segregration in the complex causal structure of inter-ethnic violence has yet to be adequately specified.

Statistics, GDP, HDI, and the Social Progress Index

That’s quite a comprehensive title to this post, isn’t it? A more serious social scientist would have prefaced the title with some cryptic phrase ending with a colon, and then added the information-possessing title. So, why don’t I do that. What about “Nibbling on Figs in an Octopus’ Garden: Explanation, Statistics, GDP, Democracy, and the Social Progress Index?” That sounds social ‘sciencey’ enough, I think.

Now, to get to the point of this post: one of the most important research topics in international studies is human welfare, or well-being. Before we can compare human welfare cross-nationally, we have to begin with a definition (which will guide the data-collecting process). What is human welfare? There is obviously some global consensus as to what that means, but there are differences of opinion as to how exactly human welfare should be measured. (In IS210, we’ll examine these issues right after the reading break.) For much of the last seven decades or so, social scientists have used economic data (particularly Gross Domestic Product (GDP) per capita as a measure of a country’s overall level of human welfare. But GDP measures have been supplemented by other factors over the years with the view that they leave out important components of human welfare. The UN’s Human Development Index is a noteworthy example. A more recent contribution to this endeavour is the Social Progress Index (SPI) produced by the Social Progress Imperative.

HDI–Map of the World (2013)

How much better, though, are these measures than GDP alone? Wait until my next post for answer. But, in the meantime, we’ll look at how “different” the HDI and the SPI are. First, what are the components of the HDI?

“The Human Development Index (HDI) measures the average achievements in a country in three basic dimensions of human development: a long and healthy life, access to knowledge and a decent standard of living.”

So, you can see that it goes beyond simple GDP, but don’t you have the sense that many of the indicators–such as a long and healthy life–are associated with GDP? And there’s the problem of endogeneity–what causes what?

The SPI is a recent attempt to look at human welfare even more comprehensively, Here is a screenshot showing the various components of that index:

Screen shot 2014-01-23 at 2.17.50 PMWe can see that there are some components–personal rights, equity and inclusion, access to basic knowledge, etc.,–that are absent from the HDI. Is this a better measure of human well-being than the HDI, or GDP alone? What do you think?

How much does political culture explain?

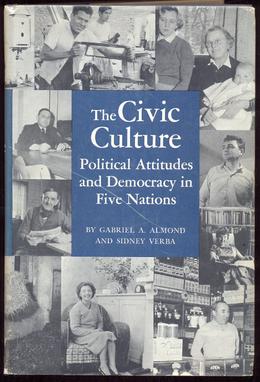
For decades now, comparativists have debated the usefulness of cultural explanations of political phenomena. In their path-breaking book, The Civic Culture, Almond and Verba argued that there was a relationship between, what they called, a country’s political culture and the nature and quality of democracy. (In fact, the relationship is a bit more complex in that the believed that a country’s political culture mediated the link between individual attitudes and the political system.) Moreover, the political culture was itself a product of underlying and enduring socially cultural factors, such as either an emphasis on the family, bias towards individualism, etc. Although Almond and Verba studied only five countries–the United States, West Germany, Mexico, Italy, and the United Kingdom–they suggested that the results could be generalized to (all) other countries.

How much, however, does culture explain? Can it explain why some countries have strong economies? Or why some countries have strong democracies? We know that cultural traits and values are relatively enduring, so how can we account for change? We know that a constant can not explain a variable.

The 1963 Cover of Almond and Verba's classic work.

In a recent op-ed piece in the New York Times, Professor Stephen L. Sass asks whether China can innovate its way to technological and economic dominance over the United States. There is much consternation in the United States over recent standardized test scores showing US students doing poorly, relative to their global peers, on science exams. (How have Canadian students been faring?)

Professor Sass answers his own question in the negative. Why, in his estimation, will China not innovate to the top? In a word (well, actually two words)–political culture:

Free societies encourage people to be skeptical and ask critical questions. When I was teaching at a university in Beijing in 2009, my students acknowledged that I frequently asked if they had any questions — and that they rarely did. After my last lecture, at their insistence, we discussed the reasons for their reticence.

Several students pointed out that, from childhood, they were not encouraged to ask questions. I knew that the Cultural Revolution had upturned higher education — and intellectual inquiry generally — during their parents’ lifetimes, but as a guest I didn’t want to get into a political discussion. Instead, I gently pointed out to my students that they were planning to be scientists, and that skepticism and critical questioning were essential for separating the wheat from the chaff in all scholarly endeavors.

Although Sass admits that there are institutional and other reasons that will also serve to limit China’s future technological innovation, he ends up affirming the primacy of political culture:

Perhaps I’m wrong that political freedom is critical for scientific innovation. As a scientist, I have to be skeptical of my own conclusions. But sometime in this still-new century, we will see the results of this unfolding experiment. At the moment, I’d still bet on America.

Do you agree? What other important political phenomena can be explained by political culture?

Nomothetic Explanations and Fear of Unfamiliar Things

Bringing two concepts together, in Research Methods today we discussed the MTV show 16 and Pregnant as part of our effort to look at cause-and-effect relationships in the social sciences. The authors of a new study on the aforementioned television program demonstrate a strong link between viewership and pregnancy awareness (including declining pregnancy rates) amongst teenagers.

We used this information, along with a hypothesized link between playing video games and violent behaviour. I then asked students to think about another putatively causal relationship that was similar to these two, from which we could derive a more general, law-like hypothesis or theory.

The computer lab presented us with another opportunity to think about moving from more specific and contextual causal claims to more general ones. Upon completion of the lab, one of the students remarked that learning how to use the R statistical program wasn’t too painful and that he had feared having to learn it. “I guess I’m afraid of technology,” he remarked. Then he corrected himself to say that this wasn’t true, since he didn’t fear the iphone, or his Mac laptop, etc. So, we agreed that he only feared technology with which he was unfamiliar. I then prodded him and others to use this observation to make a broader claim about social life. And the claim was “we fear that with which we are unfamiliar.” That is generalizing beyond the data that we’ve just used to extrapolate to other areas of social life.

Our finishing hypothesis, then, was extended to include not only technology, but people, countries, foods, etc.

P.S. Apropos of the attached TED talk, do we fear cannibals because we are unfamiliar with them?

Television makes us do crazy things…or does it?

During our second lecture in Research Methods, when asked to provide an example of a relational statement, one student offered the following:

Playing violent video games leads to more violent inter-personal behaviour by these game-playing individuals.

That’s a great example, and we used this in class for a discussion of how we could go about testing whether this statement is true. We then surmised that watching violence on television may have similar effects, though watching is more passive than “playing”, so there may not be as great an effect.

If television viewing can cause changes in our behaviour that are not socially productive, can it also lead viewers to change their behaviour in a positive manner? There’s evidence to suggest that this may be true. In a recent study, 

there is evidence to suggest that watching MTV’s 16 and Pregnant show is associated with lower rates of teen pregnancy. What do you think about the research study?

More on Milgram’s Methods of Research

In a previous post, I introduced Stanley Milgram’s experiments on obedience and authority. We watched a short video clip in class and students responded to questions about Milgram’s research methods. Upon realizing that the unwitting test subjects were all males, one student wondered whether that would have biased the results in a particular direction. The students hypothesized that women may have been much less likely to defer to authority and continue to inflict increasing doses of pain on the test-takers. While there are good reasons to believe either that women would be more or less deferential than are men, what I wanted to emphasize is the broader point about evidence and theory as it relates to research method and research ethics.

The 'sophisticated' machinery of the Milgram Obedience Experiment
The ‘sophisticated’ machinery of the Milgram Obedience Experiment

In the video clip, Milgram states candidly that his inspiration for his famous experiments was the Nazi regime’s treatment of Europe’s Jews, both before and during World War II. He wanted to understand (explain) why seemingly decent people in their everyday lives could have committed and/or allowed such atrocities to occur. Are we all capable of being perpetrators of, or passive accomplices to, severe brutality towards our fellow human beings?

Milgram’s answer to this question is obviously “yes!” But Milgram’s methods of research, his way of collecting the evidence to test his hypothesis, was biased in favour of confirming his predetermined position on the matter. His choice of lab participants is but one example. This is not good social science, however. The philosopher of science, Carl Hempel, long ago (1966) laid out the correct approach to  producing good (social) science:

  1. Have a clear model (of the phenomenon under study), or process, that one hypothesizes to be at work.
  2. Test out the deductive implications of that model, looking at particularly the implications that seem to be least plausible,
  3. Test these least plausible implications against empirical reality.

If even these least plausible implications turn out to be confirmed by the model, then you have srong evidence to suggest that you’ve got a good model of the phenomenon/phenomena of interest. As the physicist Richard Feynman (1965) once wrote,

…[through our experiments] we are trying to prove ourselves wrong as quickly as possible, because only in that way can we find progress.

Did the manner in which Milgram set up his experiment give him the best chance to “prove himself wrong as quickly as possible” or did he stack the deck in favour of finding evidence that would confirm his hypothesis?