
Here is an interesting table from the United States Department of Agriculture (USDA) website, which compares food expenditures across different countries of the world. Notice the wide disparity between the developed world and many developing countries. I found it particularly noteworthy that Croatians spend fully 1/3 of their income on food. I can say that I have first-hand evidence that this is true. The reasons for this are complex (Croatia is not a poor country, at least compared to those countries with which it shares food expenditure characteristics) but have to do with small population size and small farm size, along with an overvalued (for political reasons) currency vis-a-vis countries from which Croatia imports a lot of foodstuffs.
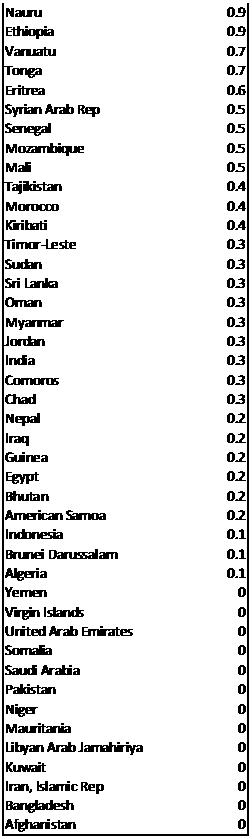
Look at Pakistan!! Wow!
| Table 97 Percent of household final consumption expenditures spent on food, alcoholic beverages, and tobacco that were consumed at home, by selected countries, 20061 |
||||
| Country/Territory | Share of household final consumption expenditures | |||
| Food2 | Alcoholic beverages and tobacco | Total household final consumption expenditures3 | Expenditure per capita on food2 | |
| Percent | U.S. dollars per person | |||
| United States | ||||
| ERS estimate | 5.8 | NA | NA | 1,848 |
| Euromonitor estimate | 7.2 | 2.0 | 30,624 | 2,204 |
| Singapore | 8.1 | 2.3 | 12,000 | 975 |
| Ireland | 8.2 | 5.0 | 22,022 | 1,812 |
| United Kingdom | 8.7 | 3.6 | 24,205 | 2,097 |
| Canada | 9.3 | 3.8 | 21,526 | 1,994 |
| United Arab Emirates | 10.1 | 0.6 | 8,099 | 816 |
| Netherlands | 10.4 | 3.0 | 18,593 | 1,937 |
| Switzerland | 10.4 | 3.6 | 29,124 | 3,040 |
| Denmark | 10.9 | 3.6 | 24,175 | 2,629 |
| Austria | 11.1 | 2.6 | 20,666 | 2,289 |
| Germany | 11.2 | 3.5 | 19,811 | 2,226 |
| Australia | 11.2 | 4.1 | 19,991 | 2,247 |
| Sweden | 11.9 | 3.5 | 19,367 | 2,302 |
| Kuwait | 12.0 | 1.3 | 11,083 | 1,324 |
| Finland | 12.4 | 4.8 | 19,268 | 2,392 |
| New Zealand | 12.5 | 4.4 | 15,107 | 1,882 |
| Norway | 12.8 | 4.3 | 28,026 | 3,591 |
| Hong Kong, China | 13.0 | 0.8 | 15,199 | 1,979 |
| Belgium | 13.2 | 3.7 | 19,313 | 2,546 |
| France | 13.9 | 3.1 | 19,931 | 2,776 |
| Japan | 14.3 | 3.1 | 19,320 | 2,768 |
| Spain | 14.6 | 3.3 | 15,724 | 2,304 |
| Italy | 14.9 | 2.8 | 18,396 | 2,745 |
| Malaysia | 15.0 | 1.2 | 2,412 | 361 |
| South Korea | 15.1 | 2.6 | 9,668 | 1,464 |
| Greece | 15.6 | 5.0 | 14,469 | 2,259 |
| Slovenia | 15.9 | 4.4 | 9,836 | 1,568 |
| Czech Republic | 17.0 | 8.0 | 6,723 | 1,146 |
| Hungary | 17.8 | 8.2 | 7,239 | 1,291 |
| Portugal | 18.0 | 4.0 | 11,533 | 2,072 |
| Israel | 18.1 | 1.7 | 10,624 | 1,926 |
| Estonia | 18.4 | 8.6 | 6,206 | 1,141 |
| Latvia | 19.0 | 6.3 | 5,606 | 1,063 |
| Slovakia | 19.2 | 4.9 | 5,777 | 1,112 |
| Argentina | 20.1 | 3.3 | 3,325 | 667 |
| Saudi Arabia | 21.4 | 1.1 | 3,519 | 752 |
| South Africa | 21.4 | 4.6 | 3,146 | 674 |
| Poland | 22.1 | 7.4 | 4,968 | 1,099 |
| Chile | 23.7 | 0.8 | 4,332 | 1,025 |
| Taiwan | 23.9 | 2.1 | 9,961 | 2,377 |
| Mexico | 24.5 | 2.5 | 5,293 | 1,296 |
| Brazil | 24.7 | 1.9 | 2,915 | 721 |
| Lithuania | 24.9 | 6.4 | 5,752 | 1,432 |
| Colombia | 25.5 | 4.4 | 1,741 | 444 |
| Thailand | 25.8 | 5.6 | 1,809 | 467 |
| Indonesia | 26.7 | 2.0 | 979 | 262 |
| Philippines | 27.4 | 2.1 | 943 | 258 |
| China | 27.8 | 2.2 | 746 | 207 |
| Ecuador | 28.5 | 5.8 | 1,144 | 326 |
| Turkey | 28.7 | 5.1 | 3,626 | 1,040 |
| Bolivia | 29.1 | 2.2 | 715 | 208 |
| Venezuela | 29.4 | 3.1 | 2,413 | 709 |
| Bulgaria | 29.5 | 4.2 | 2,796 | 824 |
| Peru | 29.6 | 2.0 | 2,002 | 593 |
| Russia | 31.4 | 2.5 | 3,278 | 1,029 |
| Turkmenistan | 32.7 | 2.7 | 798 | 261 |
| India | 33.4 | 2.3 | 421 | 141 |
| Croatia | 33.9 | 4.1 | 5,281 | 1,791 |
| Romania | 34.6 | 5.0 | 4,285 | 1,481 |
| Kazakhstan | 36.6 | 3.5 | 2,267 | 829 |
| Tunisia | 36.7 | 1.0 | 1,875 | 688 |
| Vietnam | 39.7 | 2.9 | 426 | 169 |
| Nigeria | 40.7 | 2.5 | 412 | 168 |
| Pakistan | 41.5 | 2.5 | 44 | 18 |
| Egypt | 41.5 | 2.5 | 1,032 | 428 |
| Ukraine | 43.1 | 6.4 | 1,408 | 606 |
| Jordan | 43.6 | 5.1 | 1,648 | 718 |
| Algeria | 43.7 | 2.0 | 1,204 | 526 |
| Morocco | 44.8 | 1.5 | 1,156 | 517 |
| Belarus | 47.3 | 6.3 | 1,835 | 868 |
| Azerbaijan | 51.6 | 2.4 | 912 | 471 |
| NA=Not available. 1The data are computed by Birgit Meade (202-694-5159, bmeade@ers.usda.gov), ERS/USDA, EUROMONITOR data, March 2006. 2Includes nonalcoholic beverages. 3Household expenditures for goods and services. |
||||


You must be logged in to post a comment.