Development and Underdevelopment–the Commanding Heights

We addressed the topic of development and underdevelopment in POLI 1100 this week. Amongst the many issues covered, we started to explore some of the alleged causes of economic growth and development. Why is there still such disparity in income and economic growth around the world, not only between countries, but within? Why have countries in the global “South” lagged behind, for the most part, their counterparts in the global “North”? There are various answers to this question and we addressed a couple of them in class. I showed clips from a fantastic documentary series put together by PBS, called (and based on the book of the same name) The Commanding Heights. All the information you’ll need is at the PBS website. Fortunately, each of the three 2-hour episodes has also been uploaded (in its entirety) to the Internet. From the narration at the beginning of the first episode, we learn that

This is the story of how the new global economy was born. A century-long battle as to which would control the commanding heights of the world’s economies–governments or markets.

I encourage you to watch all three episodes.


Global Debt Crisis and Relief

The issue of the global debt crisis–and particularly the onerous debt levels of developing world (“Southern”) countries–was a topic that we covered in POLI 1100 today. It will allow me to combine two class topics–issues pertaining development and underdevelopment, and interest groups (NGOs)–into one blog post. The interest group, Global Issues, is dedicated to analyzing “social, political, economic, and environmental issues that affect us all” and has a section on debt relief for the developing world. Here are some facts and figures related to the scale of the debt crisis in the developing world:

Consider the following:

  • In 1970, the world’s poorest countries (roughly 60 countries classified as low-income by the World Bank), owed $25 billion in debt.
  • By 2002, this was $523 billion
  • For Africa,
    • In 1970, it was just under $11 billion
    • By 2002, that was over half, to $295 billion
  • Debts owed to the multilateral institutions such as the IMF and World Bank is currently around $153 billion
  • For the poorest countries debts to multilateral institutions is around $70 billion.

$550 billion has been paid in both principal and interest over the last three decades, on $540bn of loans, and yet there is still a $523 billion dollar debt burden.

Here are some remarks by Professor Susan George on how to tackle the debt crisis. Money quote:

…there is no level of human suffering, which in and of itself, is going to change policy. The only way policy changes is because people demand it, and in this case, it has to be the people of the North, because the people of the South have very little political clout.

How much of Your Income is Spent of Food?

Here is an interesting table from the United States Department of Agriculture (USDA) website, which compares food expenditures across different countries of the world.  Notice the wide disparity between the developed world and many developing countries.  I found it particularly noteworthy that Croatians spend fully 1/3 of their income on food.  I can say that I have first-hand evidence that this is true.  The reasons for this are complex (Croatia is not a poor country, at least compared to those countries with which it shares food expenditure characteristics) but have to do with small population size and small farm size, along with an overvalued (for political reasons) currency vis-a-vis countries from which Croatia imports a lot of foodstuffs.

Look at Pakistan!!  Wow!

Table 97
Percent of household final consumption expenditures spent on food, alcoholic beverages, and tobacco that were consumed at home, by selected countries, 20061
Country/Territory Share of household final consumption expenditures
Food2 Alcoholic beverages and tobacco Total household final consumption expenditures3 Expenditure per capita on food2
Percent U.S. dollars per person
United States
ERS estimate 5.8 NA NA 1,848
Euromonitor estimate 7.2 2.0 30,624 2,204
Singapore 8.1 2.3 12,000 975
Ireland 8.2 5.0 22,022 1,812
United Kingdom 8.7 3.6 24,205 2,097
Canada 9.3 3.8 21,526 1,994
United Arab Emirates 10.1 0.6 8,099 816
Netherlands 10.4 3.0 18,593 1,937
Switzerland 10.4 3.6 29,124 3,040
Denmark 10.9 3.6 24,175 2,629
Austria 11.1 2.6 20,666 2,289
Germany 11.2 3.5 19,811 2,226
Australia 11.2 4.1 19,991 2,247
Sweden 11.9 3.5 19,367 2,302
Kuwait 12.0 1.3 11,083 1,324
Finland 12.4 4.8 19,268 2,392
New Zealand 12.5 4.4 15,107 1,882
Norway 12.8 4.3 28,026 3,591
Hong Kong, China 13.0 0.8 15,199 1,979
Belgium 13.2 3.7 19,313 2,546
France 13.9 3.1 19,931 2,776
Japan 14.3 3.1 19,320 2,768
Spain 14.6 3.3 15,724 2,304
Italy 14.9 2.8 18,396 2,745
Malaysia 15.0 1.2 2,412 361
South Korea 15.1 2.6 9,668 1,464
Greece 15.6 5.0 14,469 2,259
Slovenia 15.9 4.4 9,836 1,568
Czech Republic 17.0 8.0 6,723 1,146
Hungary 17.8 8.2 7,239 1,291
Portugal 18.0 4.0 11,533 2,072
Israel 18.1 1.7 10,624 1,926
Estonia 18.4 8.6 6,206 1,141
Latvia 19.0 6.3 5,606 1,063
Slovakia 19.2 4.9 5,777 1,112
Argentina 20.1 3.3 3,325 667
Saudi Arabia 21.4 1.1 3,519 752
South Africa 21.4 4.6 3,146 674
Poland 22.1 7.4 4,968 1,099
Chile 23.7 0.8 4,332 1,025
Taiwan 23.9 2.1 9,961 2,377
Mexico 24.5 2.5 5,293 1,296
Brazil 24.7 1.9 2,915 721
Lithuania 24.9 6.4 5,752 1,432
Colombia 25.5 4.4 1,741 444
Thailand 25.8 5.6 1,809 467
Indonesia 26.7 2.0 979 262
Philippines 27.4 2.1 943 258
China 27.8 2.2 746 207
Ecuador 28.5 5.8 1,144 326
Turkey 28.7 5.1 3,626 1,040
Bolivia 29.1 2.2 715 208
Venezuela 29.4 3.1 2,413 709
Bulgaria 29.5 4.2 2,796 824
Peru 29.6 2.0 2,002 593
Russia 31.4 2.5 3,278 1,029
Turkmenistan 32.7 2.7 798 261
India 33.4 2.3 421 141
Croatia 33.9 4.1 5,281 1,791
Romania 34.6 5.0 4,285 1,481
Kazakhstan 36.6 3.5 2,267 829
Tunisia 36.7 1.0 1,875 688
Vietnam 39.7 2.9 426 169
Nigeria 40.7 2.5 412 168
Pakistan 41.5 2.5 44 18
Egypt 41.5 2.5 1,032 428
Ukraine 43.1 6.4 1,408 606
Jordan 43.6 5.1 1,648 718
Algeria 43.7 2.0 1,204 526
Morocco 44.8 1.5 1,156 517
Belarus 47.3 6.3 1,835 868
Azerbaijan 51.6 2.4 912 471
NA=Not available.
1The data are computed by Birgit Meade (202-694-5159, bmeade@ers.usda.gov), ERS/USDA, EUROMONITOR data, March 2006.
2Includes nonalcoholic beverages.
3Household expenditures for goods and services.

Resource Dependent Regimes in Sub-Saharan Africa

Jensen and Wantchekon (2000) have created an index of resource dependence and determined the level of the same for the states of sub-Sarahan Africa.  The scores range from 1 (no resource dependence) to 4 (extreme resource dependence).  They use this as an important independent variable in determining democratic transition, consolidation, and government effectiveness.  How much of an effect does resource dependence have on each of these dependent variables?  You’ll have to read the paper to find out, or attend my class in intro to comparative tomorrow.

resource_dependence_scores.jpg

The Political Economy of Assassination

Today in intro to IR, we discussed the role of individuals in international politics.  On Friday, we’ll look at the policy debate on page 152 of Mingst, where the debate question is “Should ‘bad’ or ‘corrupt’ leaders be forcibly removed by the international community?  Mingst provides arguments for and against.  What about not only removing them, but having them assassinated?  Two economists–Ben Olken and Ben Jones–have decided to take a look at the link between assassinations and other factors such as democratization and economic growth.  What have they found?

Olken wonders whether economic devel­opment and the path to democratization are shaped more by broad historical forces or by the actions of specific leaders—be they demo­cratically elected prime ministers or thuggish authoritarians…

…In “Hit or Miss? The Effect of Assassinations on Institutions and War,” Olken and Jones looked at the effects of political assassination, using a strict empirical methodology that takes into account economic conditions at the time of the killing and what Olken calls a “novel data set” of assas­sination attempts, successful and unsuccessful, between 1875 and 2004.

Olken and Jones discovered that a country was “more likely to see democratization follow­ing the assassination of an autocratic leader,” but found no substantial “effect following assassinations—or assassination attempts—on democratic leaders.” They concluded that “on average, successful assassinations of autocrats produce sustained moves toward democracy.”

…In “Do Leaders Matter? National Leadership and Growth since World War II,” Olken and Jones explored whether “individual political leaders make a difference in economic growth.” This is tricky business for the researcher because, as Olken explains, a country’s economic situa­tion can affect the election of a leader: when the economic outlook is good, for instance, presi­dents are more likely to be reelected. [This is the problem of endogeneity–JD] So Olken and Jones looked at 57 leaders who died in office from accidents or natural causes and “found big changes in growth when autocratic leaders die in office—both positive and negative,” but no sub­stantial change when democratic leaders died in office. “The results suggest,” they write, “that individual leaders can play crucial roles in shap­ing the growth of nations,” provided they are ruling with minimal or nonexistent checks and balances to their power (think Augusto Pinochet or Robert Mugabe).


The Relationship Between Wealth and Health

The BBC reports on fascinating new research, which concludes that “economic growth does not necessarily translate into improvements in child mortality.” There are two points I wish to make about this: First, it illustrates an important trend in the development literature regarding the correct metric to use to determine, and compare, levels of well-being worldwide. Historically, well-being has been captured by the crude instrument of Gross National Product (GDP) per capita, but the realization that, for many reasons, the measure was too crude to be a satisfactory indicator of well-being development led to the introduction of other measures, the most useful of which is the Human Development Index (HDI) put out by the United Nations Development Program (UNDP). (Why might GDP per capita be a misleading indicator of well-being?)

The second point follows from the first; one’s policy prescriptions vis-a-vis issues of development are to a large extent determined by just which indicator of well-being one believes best captures the essential nature of that elusive concept. As such, IGOs such as the World Bank, have focused attention on overall economic growth, while scholars such as Amartya Sen (who champions the “capabilities approach”) do not view growth tout court as a magical anti-poverty elixir.

From the BBC article:

Ten million children still die every year before their fifth birthday, 99% of them in the developing world, according to Save the Children.

A study comparing economic performance with child mortality reveals that some countries have not translated wealth into improvements across society.

Survival is too often just a “lottery”, said Save the Children’s David Mepham.

He said that even the poorest countries can cut child mortality by following simple policies, but at the moment “a child’s chance of making it to its fifth birthday depends on the country or community it is born into”.

Lagging behind

Angola comes at the bottom of a new “Wealth and Survival” league table drawn up by the UN Development Programme (UNDP).

The figures for child mortality in India are shocking
Shireen Miller
Save the children India

There are few countries in the world where there are such stark wealth contrasts as there are between the wealth of oil-rich coastal strip around the Angolan capital Luanda, and the war-ravaged interior.

UNDP statisticians calculate that more than half of the babies who die in Angola could be saved were the country to spread its wealth more fairly.

child_mortality_map.jpg

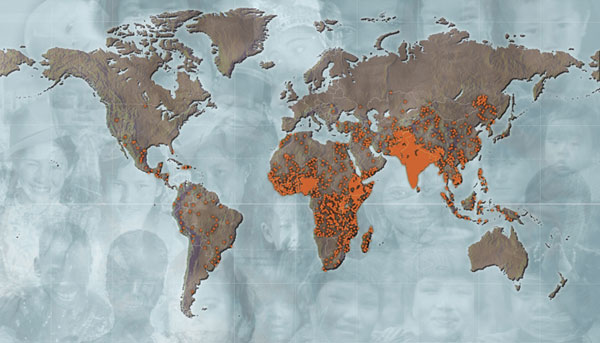
Click on the map to be taken to the Johns Hopkins Bloomberg School of Public Health’s Magazine for an article on child mortality.

[Each orange dot is equivalent to 5,000 child deaths.]


How You can Directly Promote Entrepreneurship in the Developing World

Periodically, I will use student posts as the inspiration for posts of my own here. This post is inspired by an informative post by Matt and Russ on the NGO KIVA.org. KIVA allows you, from the comfort of your keyboard, to monetarily support entrepreneurship in the developing world through facilitating the supply of micro-credit loans to budding entrepreneurs. This allows these individuals to overcome the handicap of poorly developed credit markets in these countries. [You may want to ask yourself why credit markets in most parts of the developing world are poorly developed.] For as little as $25 US, you can help a budding entrepreneur get the funding s/he needs to attempt to build a sustainable living for themselves and their families. The principal is returned to the donors (or lenders, more appropriately) within a specified time period. We’ll look at micro-credit in both PLSC240 and PLSC250 later in the course. Here is former President Bill Clinton explaining the concept of KIVA to Fox News’ Greta van Susteren.

Transparency International Corruption Perceptions Index for 2007

Economists, political scientists and practitioners have long been aware of the deleterious effects of corruption. Transparency International, an international NGO, has been playing a lead role since its inception in 1993 in the fight to highlight the problem of corruption and in creating a forceful international anti-corruption movement. What is corruption?

Corruption is the abuse of entrusted power for private gain. It hurts everyone whose life, livelihood or happiness depends on the integrity of people in a position of authority.

What are some of the effects of corruption, but obvious and hidden?

Corruption hurts everyone, and it harms the poor the most. Sometimes its devastating impact is obvious:

* A father who must do without shoes because his meagre wages are used to pay a bribe to get his child into a supposedly free school.

* The unsuspecting sick person who buys useless counterfeit drugs, putting their health in grave danger.

* A small shop owner whose weekly bribe to the local inspector cuts severely into his modest earnings.

* The family trapped for generations in poverty because a corrupt and autocratic leadership has systematically siphoned off a nation’s riches.

Other times corruption’s impact is less visible:

* The prosperous multinational corporation that secured a contract by buying an unfair advantage in a competitive market through illegal kickbacks to corrupt government officials, at the expense of the honest companies who didn’t.

* Post-disaster donations provided by compassionate people, directly or through their governments, that never reach the victims, callously diverted instead into the bank accounts of criminals.

* The faulty buildings, built to lower safety standards because a bribe passed under the table in the construction process that collapse in an earthquake or hurricane.

Corruption has dire global consequences, trapping millions in poverty and misery and breeding social, economic and political unrest.

Corruption is both a cause of poverty, and a barrier to overcoming it. It is one of the most serious obstacles to reducing poverty.

Here is a chart comparing corruption levels around the world in 2007. The higher the cpi score, the higher the level of perceived corruption.

transparency_corruption_world_map_2007.jpg

Foreign Direct Investment(FDI)–an Indicator of Globalization

As we will see, globalization is a word (and phenomenon) that is analogous to a Rorschach test in that everyone seems to have his, or her, own slightly unique definition of what it actually means. There is wide agreement, however, that an important characteristic of contemporary globalization is the level of economic integration internationally. One such component of that integration is foreign direct investment (FDI). From the World Resources Institute, here is a map that shows the differing levels of FDI around the globe. The patterns should, by now, be exceedingly familiar.

world_fdi_map_450.jpg

Here is the map description:

Foreign direct investment data do not give a complete picture of international investment in an economy. Balance of payments data on foreign direct investment do not include capital raised locally, which has become an important source of financing for investment projects in some developing countries. In addition, foreign direct investment data capture only cross-border investment flows involving equity participation and thus omit nonequity cross-border transactions such as intrafirm flows of goods and services. For a detailed discussion of the data issues see the World Bank’s World Debt Tables 1993-1994 (volume 1, chapter 3). Also, cross-country comparisons may not be accurate, because of differences in the definition of what constitutes foreign direct investment.

Source: World Bank Group. 2004, World Development Indicators Online. Washington, DC:World Bank.
Available On-line at: Source Link

A Unique Indicator of Economic Development–Luminous Flux

Or light. Below you will find a fascinating map from the World Resources Institute, (which is a great website, featuring information on such matters as renewable fresh water resources, literacy rates, and other phenomena that are found at the “intersection of the environment and human needs.”

world_city_lights.gif

Here is a description of the map:

“The National Geophysical “city lights” database depicts stable lights and radiance calibrated lights of the world (which includes lights from cities, towns, industrial sites, gas flares, fires, and lightning illuminated clouds). A high concentration of city lights is especially found in industrialized densely populated regions such as western Europe, Japan, and the U.S.. Alternatively, few “city lights” are shown in economically poorer and sparsely populated regions (e.g. central and northern Africa and South America). Moderate “city lights” are found in several densely populated “developing countries” (e.g. India, Indonesia, eastern Brazil, and South Africa). The “city lights” data may be used a proxy for population distribution or infrastructure (e.g. in which it may be assumed that the occurrence of few city lights is correlated with the presence of institutional, political, and industrial infrastructure).”