What are the sources of GHG emissions worldwide? Here is a handy chart from the World Resources Institute, via the Resilience Science blog.


What are the sources of GHG emissions worldwide? Here is a handy chart from the World Resources Institute, via the Resilience Science blog.
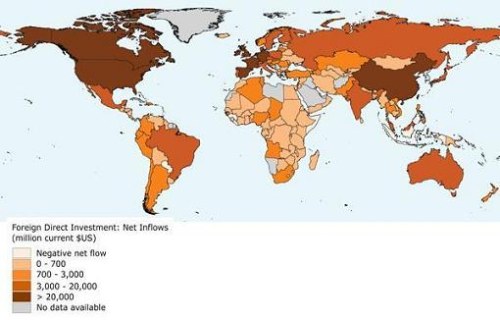
As we will see, globalization is a word (and phenomenon) that is analogous to a Rorschach test in that everyone seems to have his, or her, own slightly unique definition of what it actually means. There is wide agreement, however, that an important characteristic of contemporary globalization is the level of economic integration internationally. One such component of that integration is foreign direct investment (FDI). From the World Resources Institute, here is a map that shows the differing levels of FDI around the globe. The patterns should, by now, be exceedingly familiar.
Here is the map description:
Foreign direct investment data do not give a complete picture of international investment in an economy. Balance of payments data on foreign direct investment do not include capital raised locally, which has become an important source of financing for investment projects in some developing countries. In addition, foreign direct investment data capture only cross-border investment flows involving equity participation and thus omit nonequity cross-border transactions such as intrafirm flows of goods and services. For a detailed discussion of the data issues see the World Bank’s World Debt Tables 1993-1994 (volume 1, chapter 3). Also, cross-country comparisons may not be accurate, because of differences in the definition of what constitutes foreign direct investment.
Source: World Bank Group. 2004, World Development Indicators Online. Washington, DC:World Bank.
Available On-line at: Source Link
Or light. Below you will find a fascinating map from the World Resources Institute, (which is a great website, featuring information on such matters as renewable fresh water resources, literacy rates, and other phenomena that are found at the “intersection of the environment and human needs.”
Here is a description of the map:
“The National Geophysical “city lights” database depicts stable lights and radiance calibrated lights of the world (which includes lights from cities, towns, industrial sites, gas flares, fires, and lightning illuminated clouds). A high concentration of city lights is especially found in industrialized densely populated regions such as western Europe, Japan, and the U.S.. Alternatively, few “city lights” are shown in economically poorer and sparsely populated regions (e.g. central and northern Africa and South America). Moderate “city lights” are found in several densely populated “developing countries” (e.g. India, Indonesia, eastern Brazil, and South Africa). The “city lights” data may be used a proxy for population distribution or infrastructure (e.g. in which it may be assumed that the occurrence of few city lights is correlated with the presence of institutional, political, and industrial infrastructure).”

