One of the first things that is (or should be) taught in a quantitative methods course is that “correlation is not causation.” That is, just because we establish that a correlation between two numeric variables exists, that doesn’t mean that one of these variables in causing the other, or vice versa. And to step back ever further in our analytical process, even when we find a correlation between two numerical variables, that correlation may not be “real.” That is, it may be spurious (caused by some third variable) or an anomaly of random processes.
I’ve seen the chart below (in one form or another) for many years now and it’s been used by opponents of renewable energy to support their argument that renewable energy sources are poor substitutes for other sources (such as fossil fuels) because, amongst other things, they are more expensive for households.
In this example, the creators of the chart seem to show that there is a positive (and non-linear) relationship between the percentage of a European country’s energy that is supplied by renewables and the household price of electricity in that country. In short, the more a country’s energy grid relies on renewables, the more expensive it is for households to purchase electricity. And, of course, we are supposed to conclude that we should eschew renewables if we want cheap energy. But is this true?

No. To reiterate, a bivariate (two variables) relationship is not only not conclusive evidence of a statistical relationship truly existing between these variables, but we don’t have enough evidence to support the implied causal story–more renewbles equals higher electricity prices.
Even a casual glance at the chart above shows that countries with higher electricity prices are also countries where the standard (and thus, cost) of living is higher. Lower cost-of-living countries seem to have lower electricity prices. So, how do we adjudicate? How do we determine which variables–cost-of-living, or renewables penetration–is actually the culprit for increased electricity prices?
In statistics, we have a tool called multiple regression analysis. It is a numerical method, in which competing variables “fight it out” to see which has more impact (numerically) on the variation in the dependent (in this case, cost of electricity) variable. I won’t get into the details of how this works, as it’s complicated. But it is a standard statistical method.
So, what do we notice when we perform a multivariate linear regression analysis (note: a non-linear method actually strongly the case below even more strongly, but we’ll stick to linear regression for ease of interpretation and analysis) where we “control for” each of the two independent variables–cost-of-living and renewables penetration)?
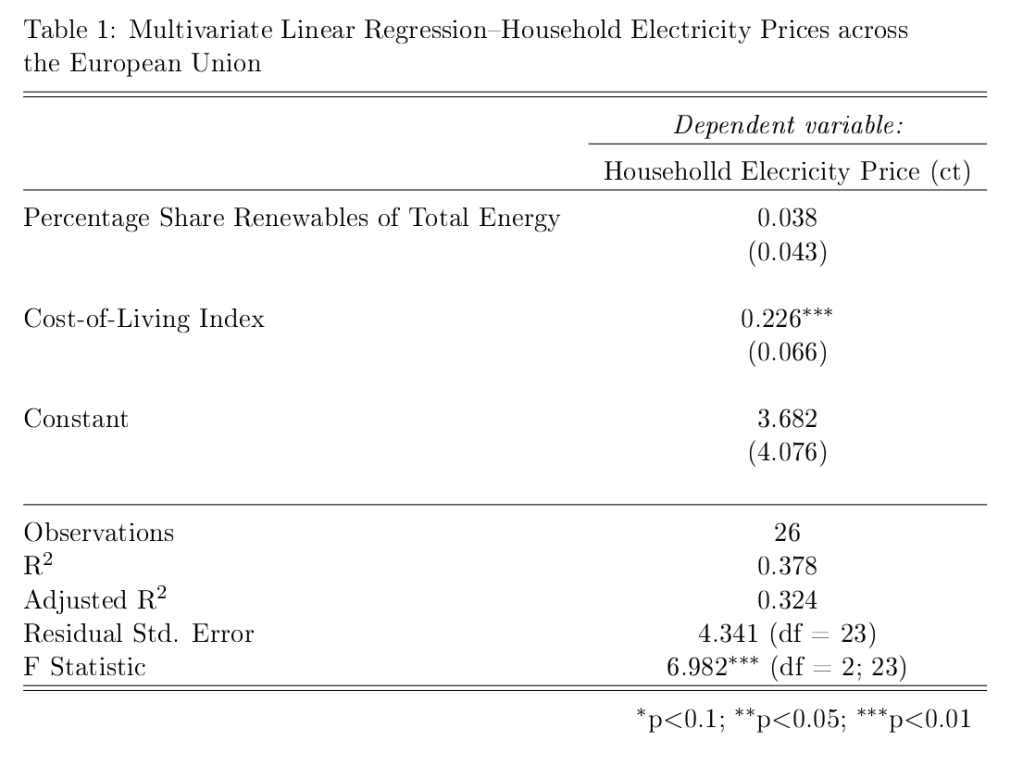
The image below shows (contrary to the implied claim in the chart above) that once we a country’s cost of living, there is little influence on the price of household electricity of renewables penetration in a country Moreover, the impact is not “statistically significant (see table at the end of the post).” That is, based on the data it is highly likely that the weak relationship we do see is simply due to random chance. We see this weak relationship in the chart below, which is the predicted cost of electricity in each country based on different levels of renewables penetration, holding the cost-of-living constant.

At only 10% of renewable penetration in a country the predicted price of electricity is about 17.5 ct/kWh (the shaded grey areas are 95% confidence bands, so we see that even though our best estimate of the price of electricity for a country that gets only 10% of its energy from renewables is 17.5 ct/kWh, we would expect the actual result to be between 14.5 ct/kWh and 20.5 ct/kWh 95% of the time. Our best estimate of the predicted cost of electricity in a country that gets 80% of its energy from renewables is expected to be about 19.5 ct/kWh. So, an 800% increase in renewables penetration leads only to only a 14.5% increase in the predicted price of electricity.
Now, what if we plot the predicted price of household electricity based on the cost-of-living after controlling for renewables penetration in a country? We see that, in this case, there is a much stronger relationship, which is statistically significant (highly unlikely for these data to produce this result randomly).

There are two things to note in the chart above. First, the 95% confidence bands are much closer together indicating much more certainty that there is a true statistical relationship between the “Cost-of-Living Index (COL)” and the predicted price of household electricity. And, we see that a 100% increase in the COL leads to a ((15.5-9.3)/9.3)*100%, or 67% increase in the predicted price of electricity in any EU country. (Note: I haven’t addressed the fact that electricity prices are a component of the COL, but they are so insignificant as to not undermine the results found here.
Stay tuned for the next post, where I’ll show that once we take out taxes and levies the relationship between the predicted price of household electricity and the penetration of renewables in an EU country is actually negative.
Here is the R code for the regression analyses, the prediction plots, and the table of regression results.
## This is the linear regression.
reg1<-lm(Elec_Price~COL_Index+Pct_Share_Total,data=eu.RENEW.only)

library(stargazer)  # needed for prediction cplots

## Here is the code for the two prediction plots.
## First plot
cplot(reg1,"COL_Index", what="prediction", main="Cost-of-Living Predicts Electricity Price (ct/kWh) across EU Countries\n(Holding Share of Renewables Constant)", ylab="Predicted Price of Electricity (ct/kWh)", xlab="Cost-of-Living Index")

## Second plot
cplot(reg1,"Pct_Share_Total", what="prediction", main="Share of Renewables doesn't Predict Electricity Price (ct/kWh) across EU Countries\n(Holding Cost-of-Living Constant)", ylab="Predicted Price of Electricity (ct/kWh)", xlab="Percentage Share of Renewables of Total Energy Use")
The table below was created in LaTeX using the fantastic stargazer (v.5.2.2) package created for R by Marek Hlavac, Harvard University. E-mail: hlavac at fas.harvard.edu


You must be logged in to post a comment.