
In data visualization posts #21 and #22, I referred to the results of simple multivariate linear regressions where I examined the statistical relationships between the cost of electricity across European Union countries and the market penetration of renewable energy sources, and a cost-of-living index. Here are the regression results that form the source data for the predictive plots in those blog posts.
First, with the price of electricity as the dependent variable (DV):
## Here is the R code for the linear regression (using the generalized linear models (glm) framework:
glm.1<-glm(Elec_Price~COL_Index+Pct_Share_Total,data=eu.RENEW.only,family="gaussian") # Electricity Price is DV
MODEL INFO:
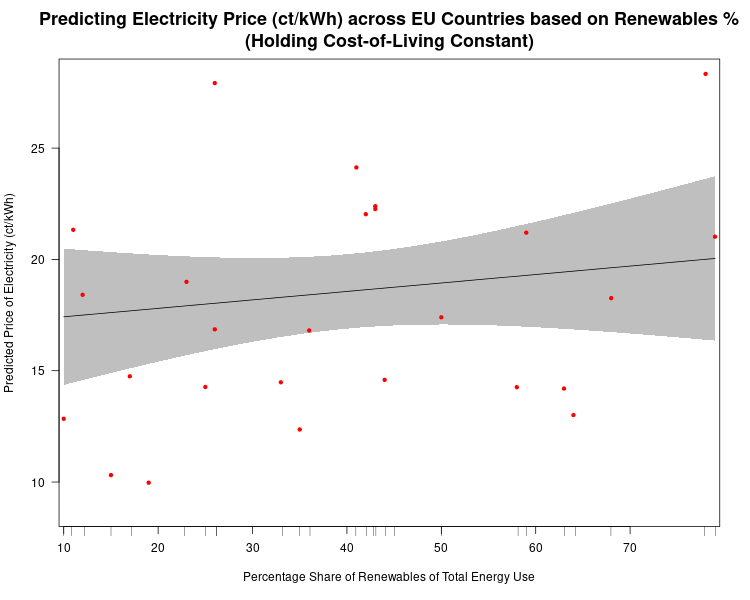
Observations: 28
Dependent Variable: Price of Household Electricity (in Euro cents)
Type: Linear regression
MODEL FIT:
χ²(2) = 306.82, p = 0.00
Pseudo-R² (Cragg-Uhler) = 0.40
Pseudo-R² (McFadden) = 0.08
AIC = 166.04, BIC = 171.37
Standard errors: MLE
-------------------------------------------------------------
Est. S.E. t val. p
------------------------------ ------ ------ -------- ------
(Intercept) 4.10 3.59 1.14 0.26
Cost-of-Living Index 0.22 0.06 3.59 0.00
Renewables (% share of total) 0.03 0.04 0.74 0.46
-------------------------------------------------------------
We can see that the cost-of-living index is positively correlated with the price of household electricity, and it is statistically significant at conventional (p=0.05) levels. The market penetration of renewables (on the other hand) is not statistically significant (once controlling for cost-of-living.
Now, we use the pre-tax price of electricity (there are large differences in levels of taxation of household electricity across EU countries) as the DV. Here are the regression code (R) and the model results of the multivariate linear regression.
## Here is the R code for the linear regression (using the generalized linear models (glm) framework:

glm.2<-glm(Elec_Price_NoTax~COL_Index+Pct_Share_Total,data=eu.RENEW.only,family="gaussian")  # Elec Price LESS taxes/levies is DV


MODEL INFO:
Observations: 28
Dependent Variable: Pre-tax price of Household Electricity (Euro cents)
Type: Linear regression

MODEL FIT:
χ²(2) = 100.13, p = 0.00
Pseudo-R² (Cragg-Uhler) = 0.44
Pseudo-R² (McFadden) = 0.12
AIC = 130.11, BIC = 135.43

Standard errors: MLE
-------------------------------------------------------------
                                 Est.   S.E.   t val.      p
-----------------------------  ------- ------ -------- ------
(Intercept)                      5.20   1.89     2.75   0.01
Cost-of-Living Index             0.14   0.03     4.41   0.00
Renewables (% share of total)   -0.03   0.02    -1.44   0.16
-------------------------------------------------------------
Here, we see an even stronger relationship between the cost-of-living and the pre-tax price of household electricity, while there is (once the cost-of-living is controlled for) a negative (though not quite statistically significant) relationship between the pre-tax cost of electricity and the market penetration of renewables across EU countries.


You must be logged in to post a comment.