In a recent working paper by Hanson and Sigman, of the Maxwell School of Citizenship and Public Affairs at Syracuse University, the authors explore the concept(s) of state capacity. The paper title–Leviathan’s Latent Dimensions: Measuring State Capacity for Comparative Political Research, complies with my tongue-in-cheek rule about the names of social scientific papers. Hanson and Sigman use statistical methods (specifically, latent variable analysis) to tease out the important dimensions of state capacity. Using a series of indexes created by a variety of scholars, organizations, and think tanks, the authors conclude that there are three distinct dimensions of state capacity, which they label i) extractive, ii) coercive, and iii) administrative state capacity.
Here is an excerpt:
The meaning of state capacity varies considerably across political science research. Further complications arise from an abundance of terms that refer to closely related attributes of states: state strength or power, state fragility or failure, infrastructural power, institutional capacity, political capacity, quality of government or governance, and the rule of law. In practice, even when there is clear distinction at the conceptual level, data limitations frequently lead researchers to use the same
empirical measures for differing concepts.
For both theoretical and practical reasons we argue that a minimalist approach to capture the essence of the concept is the most effective way to define and measure state capacity for use in a wide range of research. As a starting point, we define state capacity broadly as the ability of state institutions to effectively implement official goals (Sikkink, 1991). This definition avoids normative conceptions about what the state ought to do or how it ought to do it. Instead, we adhere to the notion that capable states may regulate economic and social life in different ways, and may achieve these goals through varying relationships with social groups…
…We thus concentrate on three dimensions of state capacity that are minimally necessary to carry out the functions of contemporary states: extractive capacity, coercive capacity, and administrative capacity. These three dimensions, described in more detail below,accord with what Skocpol identifies as providing the “general underpinnings of state capacities” (1985: 16): plentiful resources, administrative-military control of a territory, and loyal and skilled officials.
Here is a chart that measures a slew of countries on the extractive capacity dimension in
I have just graded and returned the second lab assignment for my introductory research methods class in International Studies (IS240). The lab required the students to answer questions using the help of the R statistical program (which, you may not know, is every pirate’s favourite statistical program).
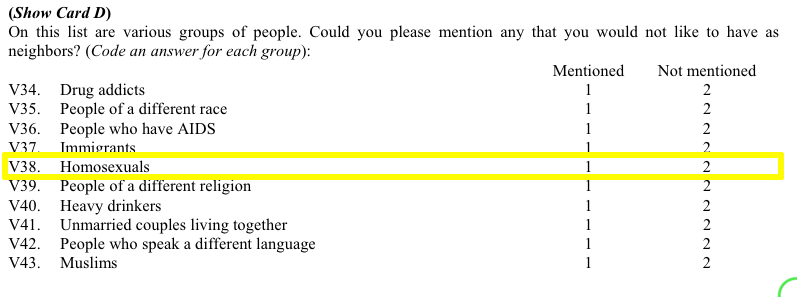
The final homework problem asked students to find a question in the World Values Survey (WVS) that tapped into homophobic sentiment and determine which of four countries under study–Canada, Egypt, Italy, Thailand–could be considered to be the most homophobic, based only on that single question.
More than a handful of you used the code below to try and determine how the respondents in each country answered question v38. First, here is a screenshot from the WVS codebook:
Students (rightfully, I think) argued that those who mentioned “Homosexuals” amongst the groups of people they would not want as neighbours can be considered to be more homophobic than those who didn’t mention homosexuals in their responses. (Of course, this may not be the case if there are different levels of social desirability bias across countries.) Moreover, students hypothesized that the higher the proportion of mentions of homosexuals, the more homophobic is that country.
But, when it came time to find these proportions some students made a mistake. Let’s assume that the student wanted to know the proportion of Canadian respondents who mentioned (and didn’t mention) homosexuals as persons they wouldn’t want to have as neighbours.
Here is the code they used (four.df is the data frame name, v38 is the variable in question, and country is the country variable):
Thus, these students concluded that almost 63% of Canadian respondents mentioned homosexuals as persons they did not want to have as neighbours. That’s downright un-neighbourly of us allegedly tolerant Canadians, don’tcha think?. Indeed, when compared with the other two countries (Egyptians weren’t asked this question), Canadians come off as more homophobic than either the Italians or the Thais.
So, is it true that Canadians are really more homophobic than either Italians or Thais? This may be a simple homework assignment but these kinds of mistakes do happen in the real academic world, and fame (and sometimes even fortune–yes, even in academia a precious few can make a relative fortune) is often the result as these seemingly unconventional findings often cause others to notice. There is an inherent publishing bias towards results that seem to run contrary to conventional wisdom (or bias). The finding that Canadians (widely seen as amongst the most tolerant of God’s children) are really quite homophobic (I mean, close to 2/3 of us allegedly don’t want homosexuals, or any LGBT persons, as neighbours) is radical and a researcher touting these findings would be able to locate a willing publisher in no time!
But, what is really going on here? Well, the problem is a single incorrect symbol that changes the findings dramatically. Let’s go back to the code:
The culprit is the | (“or”) character. What these students are asking R to do is to search their data and find the proportion of all responses for which the respondent either mentioned that they wouldn’t want homosexuals as neighbours OR the respondent is from Canada. Oh, oh! They should have used the & symbol instead of the | symbol to get the proportion of Canadian who mentioned homosexuals in v38.
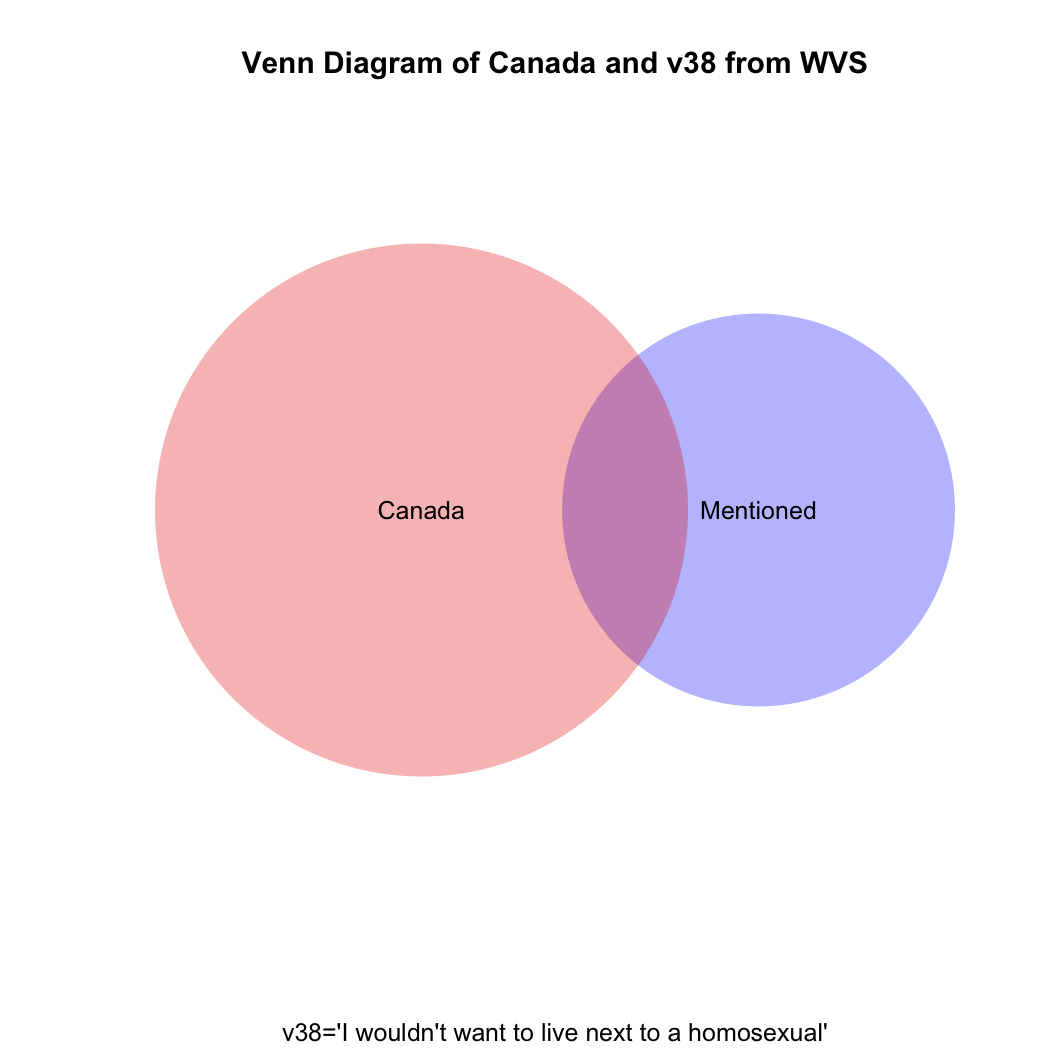
To understand visually what’s happening let’s take a look at the following venn diagram (see the attached video above for Ali G’s clever use of what he calls “zenn” diagrams to find the perfect target market for his “ice cream glove” idea; the code for how to create this diagram in R is at the end of this post). What we want is the intersection of the blue and red areas (the purple area). What the students’ coding has given us is the sum of (all of!) the blue and (all of!) the red areas.
To get the raw number of Canadians who answered “mentioned” to v38 we need the following code:
But what if you then created a proportional table out of this? You still wouldn’t get the correct answer, which should be the proportion that the purple area on the venn diagram comprises of the total red area.
Just eyeballing the venn diagram we can be sure that the proportion of homophobic Canadians is larger than 3.9%. What we need is the proportion of Canadian respondents only(!) who mentioned homosexuals in v38. The code for that is:
prop.table(table(four.df$v38[four.df$v2=="canada"]))

mentioned not mentioned
0.1404806     0.8595194
So, only about 14% of Canadians can be considered to have given a homophobic response, not the 62% our students had calculated. What are the comparative results for Italy and Thailand, respectively?
prop.table(table(four.df$v38[four.df$v2=="italy"]))

mentioned not mentioned
0.235546      0.764454

prop.table(table(four.df$v38[four.df$v2=="thailand"]))

mentioned not mentioned
0.3372781     0.6627219
The moral of the story: if you mistakenly find something in your data that runs against conventional wisdom and it gets published, but someone comes along after publication and demonstrates that you’ve made a mistake, just blame it on a poorly-paid research assistant’s coding mistake.
Here’s a way to do the above using what is called a for loop:
four<-c("canada","egypt","italy","thailand")
for (i in 1:length(four)) {
+ print(prop.table(table(four.df$v38[four.df$v2==four[i]])))
+ print(four[i])
+ }

mentioned not mentioned
0.1404806     0.8595194
[1] "canada"

mentioned not mentioned

[1] "egypt"

mentioned not mentioned
0.235546      0.764454
[1] "italy"

mentioned not mentioned
0.3372781     0.6627219
[1] "thailand"
Here’s the R code to draw the venn diagram above:
install.packages("venneuler")

library(venneuler}

v1<-venneuler(c("Mentioned"=sum(four.df$v38=="mentioned",na.rm=T),"Canada"=sum(four.df$v2=="canada",na.rm=T),"Mentioned&Canada"=sum(four.df$v2=="canada" & four.df$v38=="mentioned",na.rm=T)))

plot(v1,main="Venn Diagram of Canada and v38 from WVS", sub="v38='I wouldn't want to live next to a homosexual'", col=c("blue","red"))
For IS240 next week, (Intro to Research Methods in International Studies) we will be discussing qualitative research methods. We’ll address components of qualitative research and review issues related to reliability and validity and use these as the basis for an in-class activity.
The activity will require students to have viewed the following short video clips, all of which introduce the viewer to contemporary Myanmar. Some of you may know already that Myanmar (Burma) has been transitioning from rule by military dictatorship to democracy. Here are three aspects of Myanmar society and politics. Please watch as we won’t have time in class to watch all three clips. The clips themselves are not long (just over 3,5,and 8 minutes long, respectively).
The first clip shows the impact of heroin on the Kachin people of northern Myanmar:
The next clip is a short interview with a Buddhist monk on social relations in contemporary Myanmar:
The final video clip is of the potential impact (good and bad) of increased international tourism to Myanmar’s most sacred sites, one of which is Bagan.
We addressed the topic of development and underdevelopment in POLI 1100 this week. Amongst the many issues covered, we started to explore some of the alleged causes of economic growth and development. Why is there still such disparity in income and economic growth around the world, not only between countries, but within? Why have countries in the global “South” lagged behind, for the most part, their counterparts in the global “North”? There are various answers to this question and we addressed a couple of them in class. I showed clips from a fantastic documentary series put together by PBS, called (and based on the book of the same name) The Commanding Heights. All the information you’ll need is at the PBS website. Fortunately, each of the three 2-hour episodes has also been uploaded (in its entirety) to the Internet. From the narration at the beginning of the first episode, we learn that
This is the story of how the new global economy was born. A century-long battle as to which would control the commanding heights of the world’s economies–governments or markets.
Here’s an interesting post by a student on the effect of different electoral systems on the strategic calculations of voters. Would Canadian voters vote differently if our electoral system were PR? The evidence suggests that for a substantial minority, the answer is yes.
Here’s an example: in many (most) ridings, there is no chance that a member of the Green Party would be elected to parliament. Thus, rather than voting for the Green Party, many voters in these ridings who would prefer to vote Green, vote their 2nd preference, meaning that the Liberal Party and the NDP receive more votes during our elections than they otherwise would under a PR system. (Very few voters whose favoured party is the Green Party have the Conservative Party as their 2nd preference). Check out the post…
In POLI 1100, we have been discussing the concept and structure of legislatures. Near the end of Chapter 8 we looked at the path a bill has to traverse in Parliament before it becomes law (see Figure 8.2 of the Dyck textbook, p. 235). We viewed a video clip of MP Ruby Dhalla introducing a bill to amend the residency provisions of the OAS act. (If you don’t know what OAS stands for, watch the short video.)
We have learned in the past couple of weeks that most of the contact that you, as a Canadian citizen, have with the government is via the political executive, whether at the provincial or federal level. Apart from voting for your MP (MLA), there is very little contact between you and the legislative branch of our government. This week’s blog assignment can help change that. As I’ve noted on Blackboard, for this week’s blog assignment you can choose to write on anything to do with “legislatures”. You may, however, choose to write a letter to your MP (or any MP) in support (or opposition to) any bill that is currently in middle of the legislative process in Parliament. Here are the steps:
2. Click on “Bills before Parliament” on the left (see the screenshot below). (“Projets de loi a l’etude au Parliament”, en francais)
3. On the next page, you will see, amongst other things, a list of the “All Bills for the Current Session (41st Parliament, 1st Session). The Bills can be sorted by number (as seen below), or by “Latest Activity Date”.
4. Find a Bill that interests you, and write a letter to the MP who is sponsoring the bill. Here’s an example of a letter I wrote below:
Mr. Jean Rousseau, M.P. House of Commons
Ottawa, Ontario
K1A 0A6
Cher Monsieur Rousseau:
I am writing to you in support of Bill C-312, The Democratic Representation Act, which is currently at the Second Reading state of the legislative process in the House of Commons. As I understand it, the bill is meant to assuage the concerns of the Quebecois regarding the province of Quebec’s decreasing population, as a share of Canadian population as a whole. Bill C-312, should it be adopted into law, would maintain proportional representation of Quebec’s delegation in the House of Commons at 2006 levels, regardless of the relative proportion of Quebec’s population in the future.
While some might see this as anti-democratic in that this law would mandate a divergence from the idea that every citizen’s vote should be counted equally, I believe that the the violation of this core principle is justified in this case. (Indeed, in many areas of politics and public policy, debates centre around clashes of competing (and contradictory), fundamentally legitimate–morally and politically–principles.) In this case, the competing principle is the protection of a strong Quebec, and Quebecois society, which I believe is of inestimable value to Canadian society as a whole.
In the view of this Canadian citizen, who since immigrating to this wonderful country as an infant, has lived in the western province of British Columbia (when not living outside the country), Canada’s French heritage is an indispensable part of our country’s unique heritage and is part of the basis for the creation of what is today (though we know it hasn’t always been) a tolerant multicultural society, which is the envy of many around the world.
Sincerely,
Josip (Joseph) Dasovic
Dept of History, Latin, and Political Science
Langara College
Vancouver, BC
Do you agree with my position? Should we violate the principle of “one-person, one-vote” in the way intended by Bill C-312?
Here’s a link to a great blog post from a POLI 1100 student of mine about political ideology and the role of the family as an agent of political socialization. Here’s an excerpt:
When I got my mother to take the political compass test I was sure her result was going to show that she was much more conservative that I was. I believe I thought this because whenever my older coworkers and I discuss issues that are being highlighted in the media, most of their views on those issues seem extremely conservative to me. Or at least, more conservative than that of my own…
…My mother’s ranking on the political compass, and my ranking on the political compass turned out to be almost the same. This was interesting to me because for the 18 years of my life I spent living with her, we barely said three words to each other everyday, much less discuss politics. So my political opinions were formed from other adults around me, such as teachers and my friends parents.
This is a very interesting observation. In a book I co-authored with Alan Zuckerman and Jennifer Fitzgerald, data analysis of panel surveys in Great Britain and Germany, led to some intriguing results. One of the more interesting was the role of the family matriarch–the mother–as the lynchpin in the familial political socialization process. While it is conventionally believed that the patriarch is more influential in a child’s political socialization, this was not true in our study. Mothers spent much more time with their children than did fathers (the data sets tracked this phenomenon), and it should not be surprising that, while often mothers don’t talk about politics with their children explicitly, their quotidian interactions with their children leave the latter with all sorts of clues and cues about the way to think and act about issues that are foundationally political. For example, where to school one’s child–public secular versus private parochial school–is a fundamentally political decision, yet parents may not express their reasoning for this in explicitly political terms.
Go read the rest of the blog post, and check out our book as well.
In the National Post, Peter Godspeed argues that Prime Minister Stephen Harper’s pending visit to China represents somewhat of a foreign policy pivot for the Conservative government.
Like the United States, Canada is in the midst of a foreign policy pivot in Asia…
…Tuesday, Stephen Harper, the Prime Minister, arrives in the Chinese capital for what almost amounts to a traditional “Team Canada” trade mission, seeking to strengthen economic ties with Canada’s second-largest trading partner.
With four cabinet ministers — John Baird, the Foreign Affairs Minister, Ed Fast, the International Trade Minister, Gerry Ritz, the Agriculture Minister, and Joe Oliver, the Natural Resources Minister — and seven MPs and 40 business executives and academics, he hopes to build on rapidly expanding ties that have pushed bilateral trade to US$57.7-billion a year in 2010.
“China’s growth as an emerging market is very significant for Canada’s business community, and it is an economic relationship that requires the attention of the highest political level,” said Peter Harder, president of the Canada-China Business Council.
From the perspective of foreign-policy decision-making in IR theory, the makeup of the Team Canada mission to China would indicate the importance of the pluralist and organizational/bureaucratic models. The pluralist model notes the impact of powerful interest groups, such as the Canada-China Business Council, and business executives and academics. Radicals, especially Marxists, would note the absence of any environmental or union groups amongst the mission’s members.
About the tone of the trip, NDTV reports that
The visit can be seen as a change in attitude for Canada, which has a record of taking a hard stance on the Chinese regime’s human rights abuses, as it looks as if economic ties between the two nations are warming.
Via the New York Times, we learn of the waning popularity of the US constitution as a guide for constitution-makers worldwide. A study in the New York University Law Review, which will be published in June, shows that whereas in 1987 a vast majority of the world’s countries had “written charters modeled directly or indirectly on the U.S. version”, today the ” U.S. Constitution appears to be losing its appeal as a model for constitutional drafters elsewhere,” According to recently retired US Supreme Court justice, Ruth Bader Ginsburg [it was Sandra Day O’ Connor, of course, who recently retired from the SCOTUS], who was interviewed on Egyptian television last week (see video below), had this to say:
Two reasons that this many constitutional scholars agree with Bader Ginsburg is that i) the US constitution guarantees relatively few rights, and particularly guarantees none of the “second-” and “third-generation” rights, such as social and economic rights, and group-based cultural rights, and ii) the US constitution is notoriously difficult to amend. It is, in fact, the most difficult to amend of any constitution today. The Times wryly notes that Yugoslavia used to hold that distinction. Yugoslavia, as we know, no longer exists today.
The US constitution, however, was plenty good enough for Captain Kirk!
I recently blogged about research that does not support the conventional wisdom that individuals get more conservative as they age. What kind of research design would help us determine, with a high degree of certainty, whether individuals do, in fact, become more conservative (politically) as they age? The best would be a panel study, which interviews the same individuals over time. Ideally, it would be great if we had data on an individual’s political ideology at various stages of her lifetime.
What about comparing young people today to old people today? That, unfortunately, is not ideal since we would have to know the average political ideology of today’s elderly against their young selves. Nonetheless, I found it interesting to compare my political ideology–using the political compass test–to an individual who is a generation older than am I.
What were the results? Well, first here’s an informative chart produced by Political Compass.org.
Which one of these political leaders is the closes to you in political ideology? For me, it is the Dalai Lama. Here is my personal political ideology:
Here is the political ideology of somebody who is one generation older than I am.


You must be logged in to post a comment.