Data Visualization #9–Non-ideal use of Stacked Bar Plots

Stacked bar plots (charts) are a very useful data visualization type…when used correctly. In an otherwise excellent report on the “Escalating Terrorism Problem in the United States” from the Center for Strategic and International Studies, there is a problematic stacked bar chart (actually, a stacked percentage chart) that should have been replaced by a grouped bar chart (or something else). Here is the, in my opinion, problematic chart:

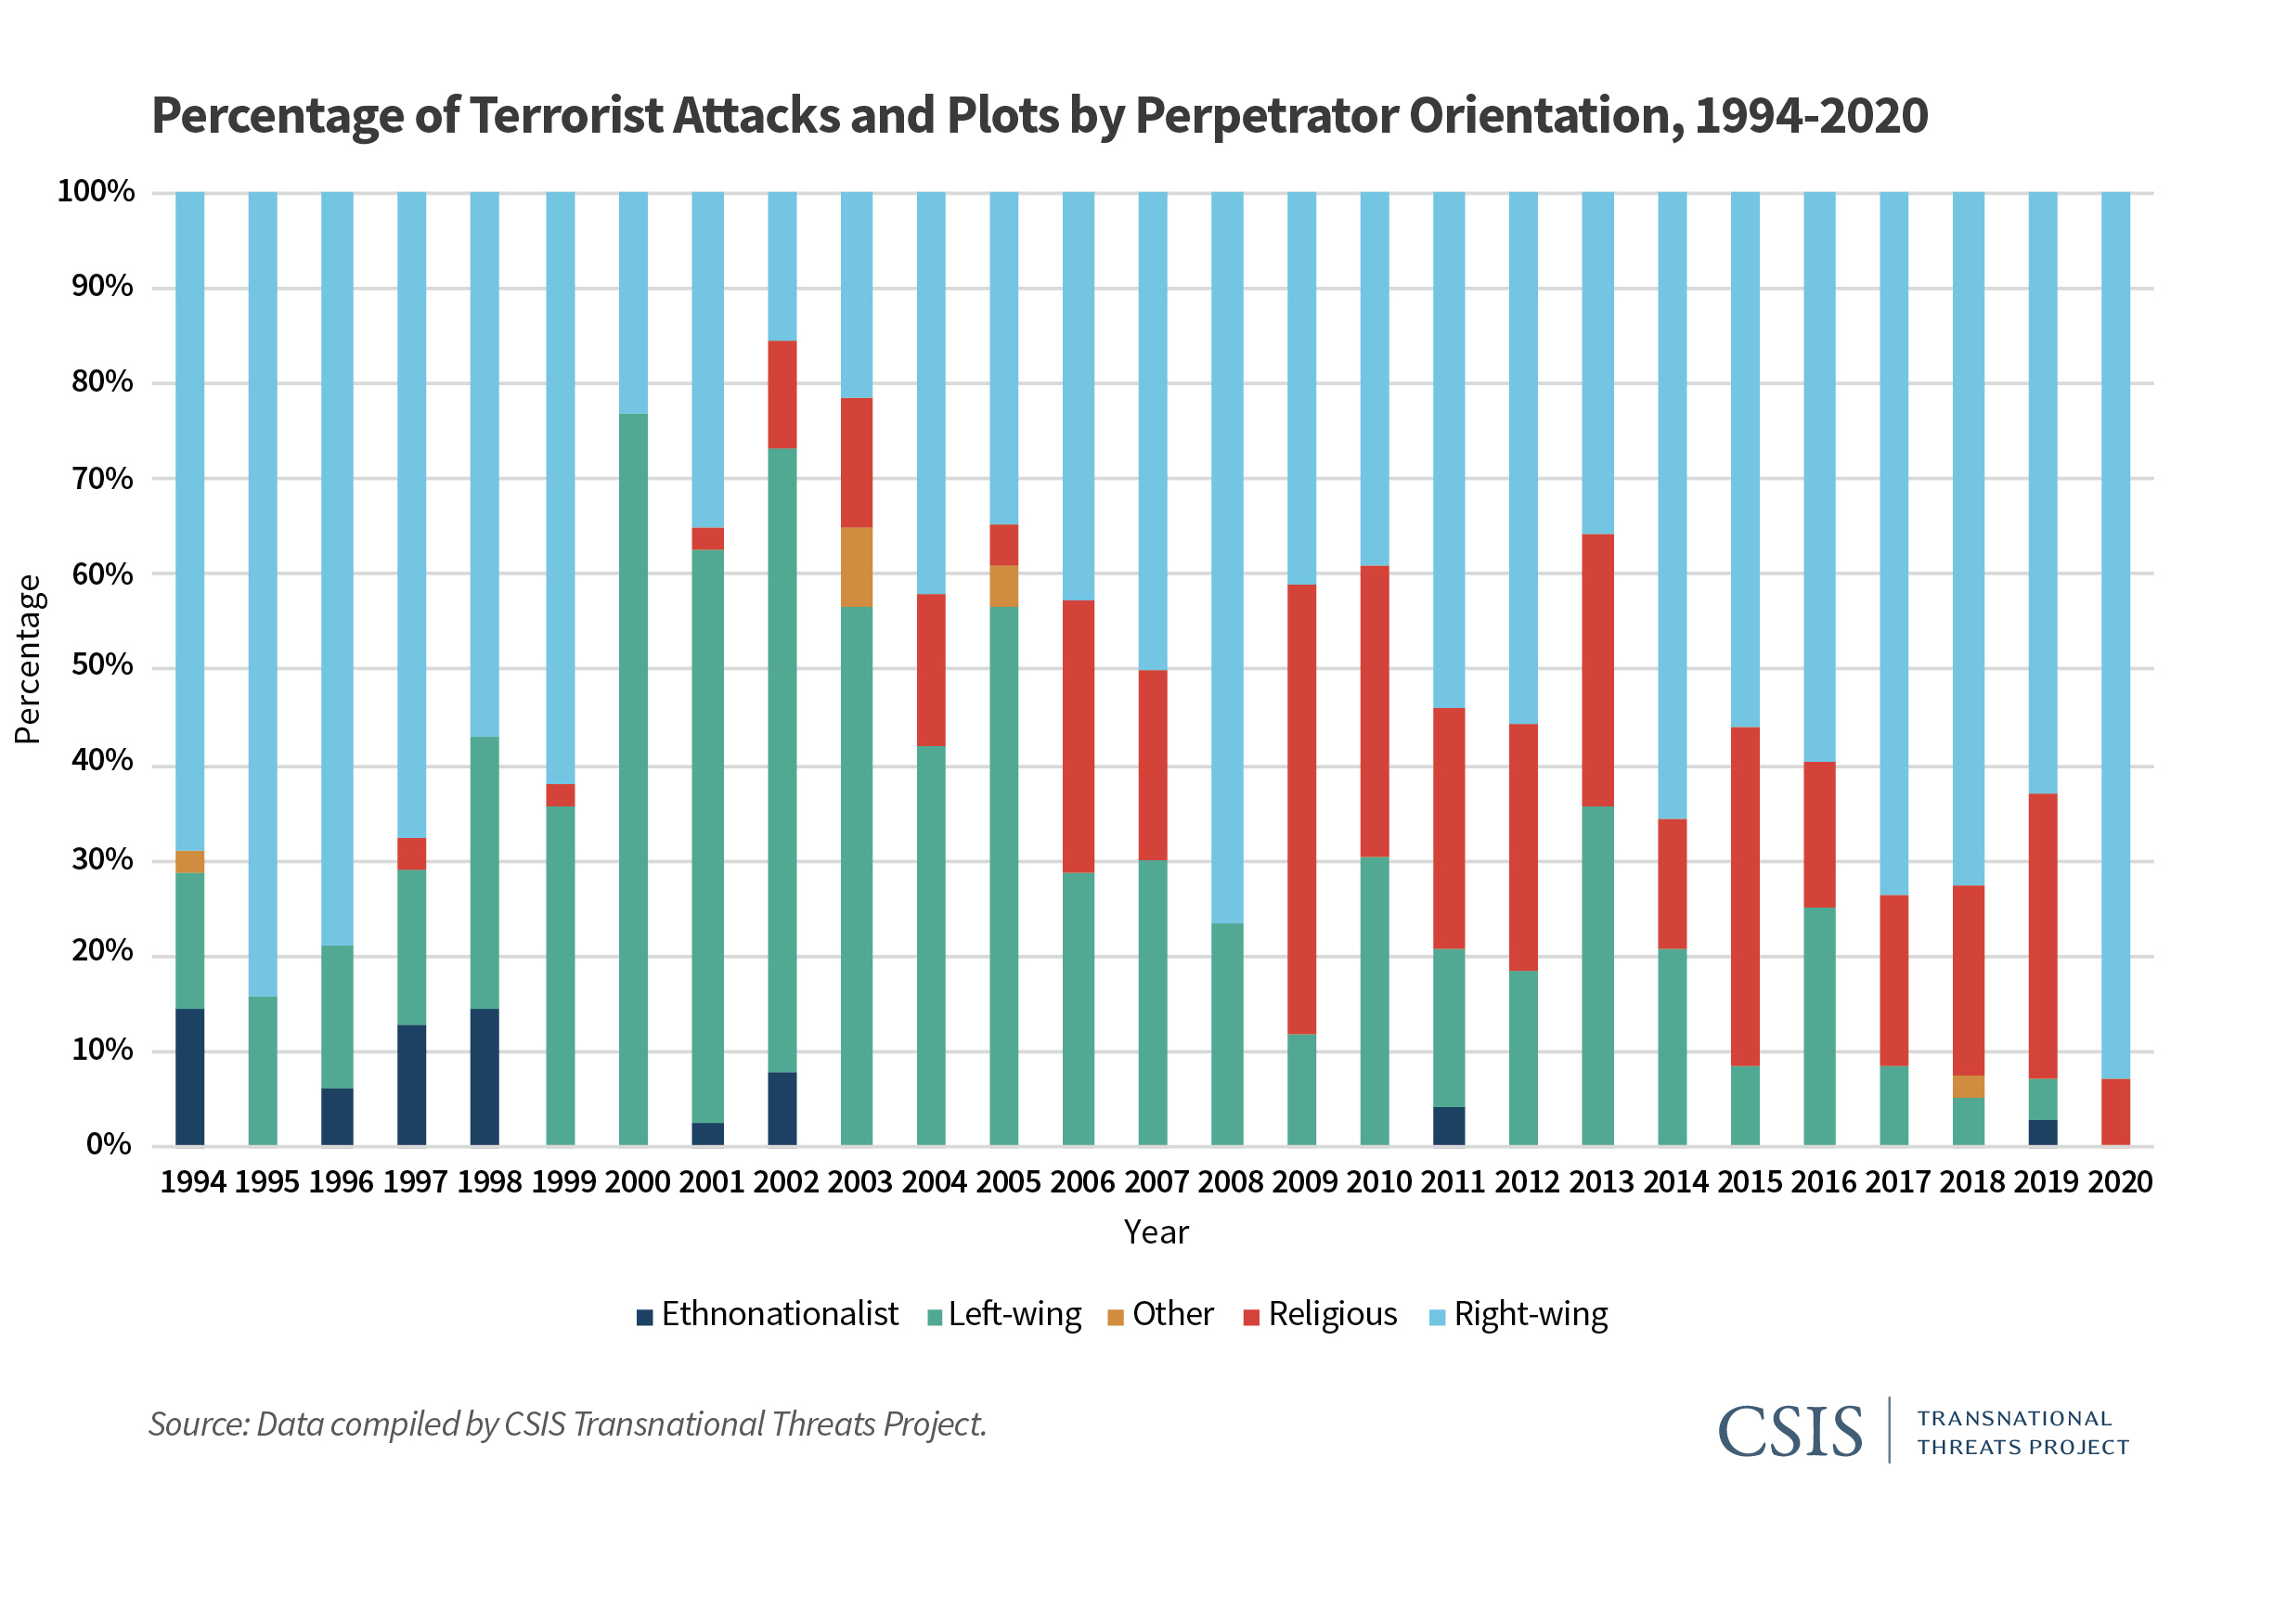
The reason I believe this chart is problematic is because the chart could potentially obscure the nature (and trend) of the underlying data. The chart above is consistent with any number of underlying data patterns. Just as an example, let’s look at 2019 and 2020. We have the following percentage breakdown over the two years:

Type of Violence20192020
Ethnonationalist3%0%
Left-wing4%0%
Other0%0%
Religious30%7%
Right-wing63%93%

While it is obvious that ethnonationalist, and left-wing, violence have decreased (they are 0% in 2020), it is not clear whether right-wing and religious violence have increased, or decreased absolutely. Does right-wing violence in 2020 comprise 93% of 14 acts of terrorist violence? Or is it 93% of 200 acts of terrorist violence? We don’t know. To be fair to the authors of the report, they do provide a breakdown in absolute numbers later in the report. Still, I believe that a more appropriate use of a stacked bar/percentage chart is when the absolute number of instances is (relatively) static over the time/area of comparison.

Here’s an example from college football. The Pacific-12 conference has two divisions–North, and South. Every year each of the 6 teams in each division plays against 4 of the teams in the other division, for a total of 24 inter-divisional games every year. In addition, there is a PAC12 Championship Game, which pits the winner of each of the two divisions against each other at the end of the year. Therefore, there are 25 total inter-divisional PAC12 football games every year. A stacked percentage chart can be used to gauge the relative winning percentages of the two divisions against each other since the establishment of the PAC12 conference in 2011 (when Utah and Colorado were added).

Created by Josip Dasović

Here, each of the years refers to a total of 25 inter-divisional games. We can easily see the nature of the quality of the respective divisions by comparing the percentage of games won by each (over the other) between the years 2011 and 2019. We see that the North (which, by the way produced 8 of the 9 PAC12 champions during this period) has generally been stronger. In 6 of the 9 years, the North won a greater percentage of the inter-divisional games than did the South. And even in those years where the South won a greater percentage of the inter-divisional games, it wasn’t a much greater percentage.

So, use stacked percentage charts only when it is appropriate.

New Pentagon Report sees Climate Change as US National Security Threat

So, if you’re not convinced by the ethical perspectives on climate change, then maybe you’ll be convinced to take it seriously if you are told that it could make state less secure going forward. In a new report from the US Department of Defence (i.e., “The Pentagon”), climate change is seen as a “threat multiplier.” In the language of Homer-Dixon, this means that climate change is viewed not as an exogenous cause of conflict, but as a factor that could negatively influence hypothesized exogenous causes of both civil and inter-state conflict. This is how Bloomberg News responded to the release of the report:

Global warming will worsen many of the challenges the U.S. military already is grappling with, the department said in areport yesterday.

“We refer to climate change as a ‘threat multiplier’ because it has the potential to exacerbate many of the challenges we are dealing with today -– from infectious disease to terrorism,” Secretary of Defense Chuck Hagel said in a blog post. “While scientists are converging toward consensus on future climate projections, uncertainty remains. But this cannot be an excuse for delaying action.”

Here is the report in its entirely. I am also providing a video excerpt of an MSNBC story on the release of the report, which has the added virtue of including an interview with the author of one of the readings that I think at least 2 of you read for Wednesday’s seminar! The author is Chris Parenti, who has written an interesting book called Climate of Chaos.

A Virtual Trip to Myanmar for my Research Methods Class

For IS240 next week, (Intro to Research Methods in International Studies) we will be discussing qualitative research methods. We’ll address components of qualitative research and review issues related to reliability and validity and use these as the basis for an in-class activity.

The activity will require students to have viewed the following short video clips, all of which introduce the viewer to contemporary Myanmar. Some of you may know already that Myanmar (Burma) has been transitioning from rule by military dictatorship to democracy. Here are three aspects of Myanmar society and politics. Please watch as we won’t have time in class to watch all three clips. The clips themselves are not long (just over 3,5,and 8 minutes long, respectively).

The first clip shows the impact of heroin on the Kachin people of northern Myanmar:

The next clip is a short interview with a Buddhist monk on social relations in contemporary Myanmar:

The final video clip is of the potential impact (good and bad) of increased international tourism to Myanmar’s most sacred sites, one of which is Bagan.

What causes civil conflict?

In a series of recent articles, civil conflict researchers Esteban, Mayoral, and Ray (see this paper for an example) have tried to answer that question. Is it economic inequality, or cultural differences? Or maybe there is a political cause at its root. I encourage you to read the paper and to have a look at the video below. Here are a couple of images from the linked paper, which you’ll see remind you of concepts that we’ve covered in IS210 this semester. The first image is only part of the “Model of Civil Conflict.” Take a look at the paper if you want to see the “punchline.”

Screen shot 2014-02-07 at 1.54.26 AM

Here is the relationship between fractionalization and polarization. What does each of these measures of diversity measure?

Screen shot 2014-02-07 at 1.56.50 AM

And here’s a nice youtube video wherein the authors explain their theory.

Does Segregation lead to interethnic violence or interethnic peace?

That’s an important question, because it not only gives us an indication of the potential to stem inter-ethnic violence in places like Iraq, Myanmar, and South Sudan, but it also provides clues as to where the next “hot spots” of inter-ethnic violence may be. For decades now, scholars have debated the answer to the question. There is empirical evidence to support bot the “yes” and “no” sides. For example, in a recent article in the American Journal of Political Science [which is pay-walled, so access it on campus or through your library’s proxy] Bhavnani et al. list some of this contradictory evidence:

How to create peace between Protestants and Catholics in Belfast? Erect 18-ft high "peace lines"
How to create peace between Protestants and Catholics in Belfast? Erect 18-ft high “peace lines”

Evidence supporting the claim that ethnic rivals should be kept apart:

  • Los Angeles riots of 1992, ethnic diversity was closely associated with rioting (DiPasquale and Glaeser 1998),
  • That same year, Indian cities in Maharashtra, Uttar Pradesh, and Bihar, each of whichhad a history of communal riots, experienced violence principally in locales where the Muslim minority was integrated. In Mumbai, where over a thousand Mus-
    lims were killed in predominantly Hindu localities, the Muslim-dominated neighborhoods of Mahim, Bandra,
    Mohammad Ali Road, and Bhindi Bazaar remained free of violence (Kawaja 2002).
  • Violence between Hindus and Muslims in Ahmedabad in 2002 was found to be significantly higher in ethnically mixed as opposed to segregated neighborhoods (Field et al. 2008).
  • In Baghdad during the mid-2000s, the majority displaced by sectarian fighting resided in neighborhoods where members of the Shi’a and Sunni communities lived in close proximity, such as those on the western side of the city (Bollens2008).

Evidence in support of the view that inter-mixing is good for peace:

  • Race riots in the British cities of Bradford, Oldham, and Burnley during the summer of 2001 were attributed to high levels of segregation (Peach 2007).
  • In Nairobi, residential segregation along racial (K’Akumu and Olima 2007) and class lines (Kingoriah 1980) recurrently produced violence.
  • In cities across Kenya’s Rift Valley, survey evidence points to a correlation between ethnically segregated residential patterns, low levels of trust, and the primacy of ethnic over national identities and violence (Kasara 2012).
  • In Cape Town, following the forced integration of blacks and coloreds by means of allocated public housing in low-income neighborhoods, a “tolerant multiculturalism” emerged (Muyeba and Seekings 2011).
  • Across neighborhoods in Oakland, diversity was negatively associated with violent injury (Berezin 2010).

Scholars have advanced many theories about the link between segregation and inter-ethnic violence (which I won’t discuss right now), but none of them appears to account for all of this empirical evidence. Of course, one might be inclined to argue that segregation is not the real cause of inter-ethnic violence, or that it is but one of many causes and that the role played by segregration in the complex causal structure of inter-ethnic violence has yet to be adequately specified.

Ghosts of Rwanda

In POLI 1140, we have read an excerpt from Rwanda section of Samantha Power’s prize-winning book, A Problem from Hell: America and the Age of Genocide, in which Power assesses the reasons for the lack of response by the Clinton administration in the spring of 1994 to the developing genocide in Rwanda. Power makes many points but one of the most trenchant is that despite the apparently early decision by Clinton that he would not send US troops to Rwanda (fearful that another Somalia could ensue), many other actions–short of sending troops-could have been taken by the US government and military. Something as simple as sending planes with the capability to jam radio frequencies may have slowed down the killing and saved countless lives.

Here is a compelling and very informative documentary by PBS’ Frontline series on the events surrounding the Rwandan genocide, paying special attention to the lack of action on the part of the United Nations and the United States. Many of the ideas in Power’s book are addressed here.

Thomas Lubanga First Person Convicted by ICC

Wednesday, March 14th, 2012 will stand as a watershed moment in international relations and in international law, specifically. Thomas Lubanga, former militia leader in the eastern Democratic Republic of Congo (DRC) is the first person ever convicted by the recently formed International Criminal Court (ICC). Though there have been dozens of convictions of war crimes suspects from the wars in the former Yugoslavia and Rwanda, these cases were process by temporary courts–the ICTY and the ICTR, respectively–and not the ICC. Lubanga was accused of conscripting, enlisting, and using child soldiers in the conflict in the Ituri region of the DRC. Rather than playing a role in the post-war political process, (which he had hoped) Lubanga was arrested in March 2005 and extradited to the ICC one year later. It is only now, seven years after his arrest, that a verdict on this case has come down.

Lubanga’s conviction is the end of a multi=year trial process, the legitimacy of which was undermined at times by the lack of prosecutorial professionalism, and other issues. For more about the trial, go here, and watch the videos below.

My Tribe is my Pain

Here is a very interesting and personal account of a Ugandan’s views about identity–tribal, ethnic, national. I encourage you to read it, but here are some snippets:

If you live in Uganda you must come across these sentiments. My last name begins with Kag-Kagumire. My blog is not under that name for many reasons but this is one of them. When I say my last name to people sometimes they will say: Kaguta, so you’re from the west, Museveni’s relative etc. Even if it’s a slight joke it evokes a feeling that I can’t describe. To associate me with someone that is increasingly becoming negative makes me mad and in my tribe most times it’s okay to be mad and show it. I take time to explain to friends, sometimes gently other times with some emotion that I am from Bushenyi and I have never been to Rwakitura and that my father doesn’t own a single head of cattle. I am a private person but for the sake of clarity I am forced to talk about all these things and now i am writing about them.

Here’s another piece that implies the shifting nature of identities:

But this kind of view is not limited to the ‘uneducated’ Ugandans. A friend once told me that his Ugandan female friend hates ‘westerners’ so much that at her work place when job applications are brought in, she sorts out the west first.  This personal level of disdain for a group of people  is unfathomable. Others point out how rich you’re and how many opportunities you get. Many times I tell the people about my life which is not the most difficult one but is not any better than that of an educated person from the east, north or central.

Ethnic (cultural) diversity and public spending

We talked a little bit in class today about the link between ethnic (cultural) diversity and public spending. The empirical record seems to find that the more ethnic diversity in a polity, the less public spending–health, education, etc.–there is. A recent article in the American Political Science Review (Habyarimana et al. 2007) addresses the theoretical mechanisms that may underlie this empirical association:

A large and growing literature links high levels of ethnic diversity to low levels of public goods provision. Yet although the empirical connection between ethnic heterogeneity and the underprovision of public goods is widely accepted, there is little consensus on the specific mechanisms through which this relationship operates. We identify three families of mechanisms that link diversity to public goods provision—what we term “preferences,” “technology,” and “strategy selection” mechanisms—and run a series of experimental games that permit us to compare the explanatory power of distinct mechanisms within each of these three families. Results from games conducted with a random sample of 300 subjects from a slum neighborhood of Kampala, Uganda, suggest that successful public goods provision in homogenous ethnic communities can be attributed to a strategy selection mechanism: in similar settings, co-ethnics play cooperative equilibria, whereas non-co-ethnics do not. In addition, we find evidence for a technology mechanism: co-ethnics are more closely linked on social networks and thus plausibly better able to support cooperation through the threat of social sanction. We find no evidence for prominent preference mechanisms that emphasize the commonality of tastes within ethnic groups or a greater degree of altruism toward co-ethnics, and only weak evidence for technology mechanisms that focus on the impact of shared ethnicity on the productivity of teams. (my emphasis)

Thus, what the experimenters found was that (at least in their experiment) co-ethnics were more likely to co-operate in a strategic setting than non-co-ethnics. An additional important factor is the ability of the threat of social sanction to be stronger within a homogenous social group, presumably due to more closely linked social networks. (“I’ll tell your mother on you!” as a threat has more of a potential enforcement effect if you think the person making the threat may actually know your mother. And the likelihood of that person knowing your mother increases, other things being equal, if s/he shares the same ethnicity as your mother.

Bosnia–education and multiculturalism

An interesting article on the education system in Bosnia, which looks at the effect of a particular view of multiculturalism in that war-scarred country. How does it compare to our system in Canada? What are the advantages/disadvantage of each system?

There was no Santa Claus in the Sarajevo and Bosnia and Herzegovina of my childhood. The white-bearded fat man who assessed the worth of children’s obedience and brought them presents was called Deda Mraz—Grandpa Frost. Having dispatched his proxies to schools and kindergartens in the preceding weeks, he showed up at your home in person (though always unseen) on New Year’s Eve, at midnight or so, just for you. He was non-denominational and non-ideological and delivered presents to all obedient children regardless of their ethnicity or political convictions. The old man was a civic, communal character, someone everyone waited for and was happy to see. He was welcome before the war, even during the war, but, it turns out, not so much after the war.

As for contemporary schooling in Bosnia,

In some parts of Bosnia, children of different ethnicities attend school in the same building, but are meticulously segregated: they go to different classrooms, share no classes, they often have different programs and textbooks, the faculty neither mix nor cooperate. In some schools, classes begin at different times, lest children have any contact or communication before or after school. … The nationalists who represent the constitutive peoples want and expect national subjects, not citizens. They want children to come out of the rickety educational machine equipped to think of themselves exclusively within the framework of their ethnicity.