
The Human Security Report Project is no longer active, and most of the content produced by the employees and staff has disappeared. There are some materials archived in the “wayback machine.” The 2010 report–titled the Shrinking Costs of War–is not available online. I am, therefore, making this copy, on which I was the chief quantitative research officer, available to the public.
Category: Uncategorized
Data Visualization #11—X-rays
If you sit down for a minute and think about it, an x-ray is the culmination of a data generating, and visualization, process. What we see on the screen is a representation (or a model) of the body part being x-rayed. Over a month ago (hence the disruption to my blogging routine) I unexpectedly had knee replacement surgery (yay for cancellation lists!). Here is an x-ray of my new right knee (airport scanners, here I come!):

The parts showing very white are new and will hopefully allow me to hike and bike pain-free from this point on. It’s been a painful, but ultimately productive, healing and rehabilitation process and I’ll be continuing my data visualization challenge beginning next week. See you soon!
‘Controlling’ for confounding variables graphically
As we’ve learned (ad nauseum) basing causal claims on a simple bivariate relationship is fraught with potential roadblocks. Even though there may be a strong, and statistically significant, relationship between an independent and dependent variable, if we haven’t controlled for potentially confounding variables, we can not state with any measure of confidence that the putative relationship between the IV and DV is causal. We should always statistically control for any (and all) potentially confounding variables.
Additionally, it is often desirable to dig deeper into the data and find out if the units-of-analysis are fundamentally different on the basis of some other variable. Below you may find two plots–each of which shows the relationship between margin of victory and electoral turnout (by electoral district) for the 2017 British Columbia provincial election. The first graph plots a simple bivariate relationship, while the second plot breaks that initial relationship down by political party (which party won the electoral district). It could conceivably be the case that the relationship between turnout and margin of victory varies across the values of political party. That is, the relationship may hold in those electoral districts where party A won, but not hold in those in which party B won.
We can see here that there is little evidence to suggest a difference in the relationship based on which party won the electoral district. Can you think of another `third’ variable that may cause the relationship between turnout and margin of victory to be systematically different across different values of that variable? What about rural-versus-urban electoral districts?
Here are the plots:


Using R to help simulate the NHL Draft Lottery
Upon discussing the NHL game results file, I mentioned to a few of you that I have used R to generate an NHL draft lottery simulator. It’s quite simple, although you do have to install the XML package, which allows us to use R to ‘scrape’ websites. We use this functionality in order to create the lottery simulator dynamically, depending on the previous evening’s (afternoon’s) game results.
Here’s the code: (remember to un-comment the install.packages(“XML”) command the first time you run the simulator). Copy and paste this code into your R console, or save it as an R script file and run it as source.
# R code to simulate the NHL Draft Lottery
# The current draft order of teams obviously changes on a
# game-to-game basis. We have to create a vector of teams in order
# from 31st to 17th place that can be updated on a game-by-game
# (or dynamic) basis.

# To do this, we can use R's ability to interrogate, scrape,
# and parse web pages.

#install.packages("XML") # NOTE: Uncomment and install this
#                                package before running this
#                                script the first time.

require(XML) # We need this for parsing of the html code

url <- ("http://nhllotterysimulator.com/") #retrieve the web page we are using as the data source
doc <- htmlParse(url) #parse the page to extract info we'll need.

# From investigation of the web page's source code, we see that the
# team names can be found in the element [td class="text-left"]
# and the odds of each team winning the lottery are in the
# element [td class="text-right"]. Without this
# information, we wouldn't know where to tell R to find the elements
# of data that we'd like to extract from the web page.
# Now we can use xml to extract the data values we need.

result.teams <- unlist(xpathApply(doc, "//td[contains(@class,'text-left')]",xmlValue)) #unlist used to create vector
result.odds <- unlist(xpathApply(doc, "//td[contains(@class,'text-right')]",xmlValue))

# The teams elements are returned as strings (character), which is
# appropriate. Also only non-playoff teams are included, which makes
# it easier for us. The odds elements are returned as strings as
# well (and percentages), which is problematic.
# First, we have 31 elements (the values of 16 of which--the playoff
# teams --are returned as missing). We only want 15 (the non-playoff
# teams).
# Second, in these remaining # 15 elements we have to remove the
# "%" character from each.
# Third, we have to convert the character format to numeric.
# The code below does the clean-up.

result.odds <- result.odds[1:15]
result.odds <- as.numeric(gsub("%"," ",result.odds)) #remove % symbol
teamodds.df <- data.frame("teams"=result.teams[1:15],"odds"=result.odds, stringsAsFactors=FALSE) #Create data frame for easier display

# Let's print a nice table of the teams, with up-to-date
# corresponding odds.

print(teamodds.df) # odds are out of 100

#Now, let's finally 'run' the lottery, and print the winner's name.

cat("The winner of the 2018 NHL Draft Lottery is the:", sample(teamodds.df$team,1,prob=teamodds.df$odds),sep="")
Polity IV Democracy Scores, Participation, and the Suffragettes
We noted today in lecture that Polity IV gives countries like the United States very high scores on the ”democraticness” variable, even during periods when a majority of the adult population–African-Americans, and women–were legally not allowed to vote. While Switzerland (1971) was the last European democracy to grant universal suffrage for women, Portugal was the last European country to do so (1976)–Portugal was run by a military dictatorship during in the early years of the 1970s.
In this era of social media abuse and bullying, it’s interesting to learn about some of the abuse hurled at the Suffragettes:
Since we all talk about political abuse on Twitter, this is really interesting on the abuse directed at the suffragettes by their opponents. Here’s a postcard sent to Emmeline Pankhurst. More here: https://t.co/j65EzWjdB3 pic.twitter.com/yReqKQEBjr
— Jim Waterson (@jimwaterson) February 6, 2018

The Economist Intelligence Unit’s Global “Livability” Survey Omits Cost-of-Living
Before we can say anything definitive about the concepts and ideas that we’re studying, it is imperative that we have some understanding about whether the data that we observe and collect are actually “tapping into” the concept of interest.
For example, if my desire were to collect data that are meant to represent how democratic a country is, it would probably not be beneficial to that enterprise to collect measures of annual rainfall. [Though, in some predominantly agricultural countries, that might be an instrument for economic growth.] Presumably, I would want to collect data like whether elections were regularly held, free, and fair, whether the judiciary was independent of elected leaders, etc. That seems quite obvious to most.
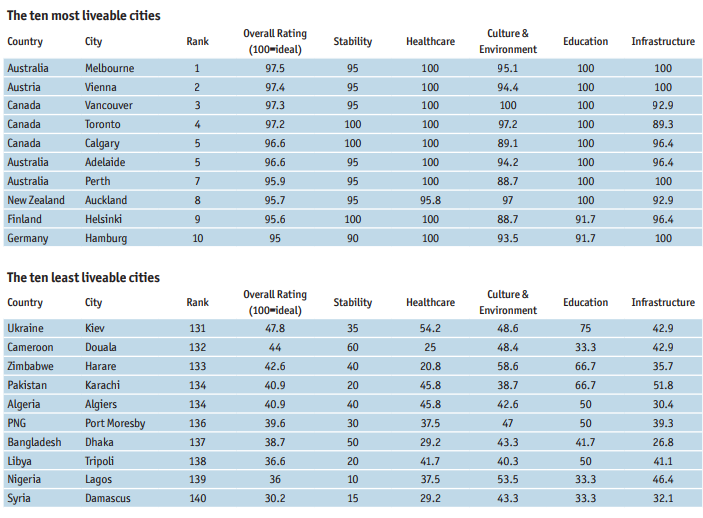
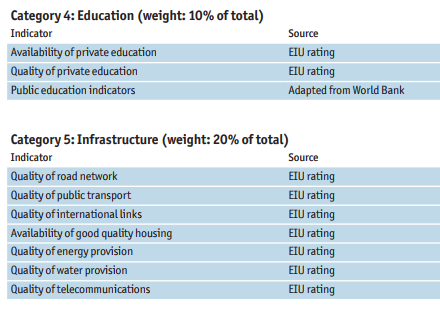
The Economist’s Intelligence Unit puts out an annual “Global Livability Report” , which claims to comparatively assess “livability” in about 140 cities worldwide. The EIU uses many different indicators (across five broad categories) to arrive at a single index value that allegedly reflects the level of livability of each city in the survey. Have a look at the indicators below. Do you notice that the cost-of-living is not include? Why might that be?

Nicholas Stern (of the Report) argues that climate agreement should not be legally binding
We used the last session of IS450 as a chance to hold a mock United Nations climate conference simulation. The participants brought forward many intriguing and instructive topics, and I applaud them for putting in the time and energy to make the simulation as successful as I, at least, judged it to be. At some point during the proceedings, there was majority agreement (finally!) on one small element of the overall framework resolution. Interestingly, though, immediately upon the successful passing of that small piece of the framework a couple of delegates put forward a motion to make the obligations legally binding. A heated discussion ensued debating the merits and disadvantages of such an approach.
In the current round of UNFCCC climate negotiations, behind held in Lima, Peru, Nicholas Stern (author of the well-known Stern Review Report on the Economics of Climate Change) has argued against making international climate treaty obligations legally binding. What is Lord Stern’s rationale for this?
“Some may fear that commitments that are not internationally legally-binding may lack credibility,” he said.
“That, in my view, is a serious mistake. The sanctions available under the Kyoto Protocol, for example, were notionally legally-binding but were simply not credible and failed to guarantee domestic implementation of commitments.”
In Lima, negotiators are trying to hammer out the format that mitigation efforts should take. By the end of March next year countries have to declare their hands, but they have yet to formalize what will be included in these commitments and what will not.
Lord Stern believes that grounding the process in the laws and promises that countries undertake by themselves is a better model for a deal than a top-down process like Kyoto.
“It will be enforceable and deliverable through the arrangements and laws in the countries themselves.
“That way you will get stronger ambition as countries won’t be tempted to be hesitant about some type of international sanction.”
What do you think about Lord Stern argument? Would you support voluntary obligations over mandatory ones?
Here is an interview with Lord Stern from earlier this week in Lima, wherein he speaks on the link between economic growth, development, and better climate responsibility?
UN Secretary-General Ban Ki-Moon Interviewed on Canadian Television
Host Peter Mansbridge, of the Canadian Broadcasting Coroporation’s (CBC) evening news program, The National, interviewed United Nations Secretary-General Ban Ki-Moon earlier this week on issues related to climate change and the Alberta oil sands. (I’ll have more next week about the anti-pipeline protests on Burnaby Mountain (in the vicinity of SFU) next week.)
Here are some excerpts:
Ban Ki-Moon: I know the domestic politics in Canada and Australia…but this is a global issue.
Peter Mansbridge: But the Canadian argument has always been, if everybody’s not in, we’re not in. [This obviously refers to the Kyoto Protocol’s division of countries into those that are required to make cuts (so-called Annex I countries) and those (mostly ‘developing’ countries) that do not.]
Ban Ki-Moon: China and [the] United States have taken such a bold initiative, Germany has been a leading country now, and [in] the European Union, twenty-eight countries have shown solidarity and unity. Therefore, it is only natural that Canada as one of the G-7 countries should take a leadership role.
The Secretary-General also spoke about the Alberta oil sands, which have been in the news lately in our part of the world as the result of protests aimed at Kinder Morgan over its plans to increase (three-fold) the flow of tar sands oil (bitumen) through an existing pipeline that runs through Burnaby Mountain to waiting oil tankers in Vancouver’s Burrard Inlet, to almost one million barrels per day.
Peter Mansbridge: Should Canadians, or the Canadian government, look beyond the oil sands to make its decisions about climate change?
Ban Ki-Moon: Energy is a very important, this is a cross-cutting issue. There are ways to make transformative changes from a fossil fuel-based economy to a climate-resilient economy by investing wisely in renewable energy resources.
Peter Manbridge: So back away from…
Ban Ki-Moon: Yes, Canada is an advanced economic country…you have many technological innovations, so with the technological innovation and financial capacity, you have many ways to make some transformative changes.
This is the key; the political and societal will has to be created and sustained to force our leaders to make the requisite changes, which will move our country towards an economy that is climate-resilient. An economically-sustainable future and economic well-being are not mutually exclusive. Indeed, there is every reason to believe that not not only are they not mutually exclusive, but that that each is necessary for the other. If we don’t start moving away from our “extractivist economic structure”, we in Canada face the prospect of a future with tremendous ecological and environmental degradation coupled with economic despair, when our leaders finally realize that rather than using our current wealth to innovate away from the extraction and toward energy innovation, we have squandered our wealth on fining ever cheaper ways to dig up crap that the world no longer wants to buy.
“Polluted and poor”–how’s that for a political campaign slogan?
‘Game-changing’ news regarding climate change?
You may also have awoken this morning to reports of a potentially ‘game-changing’ deal between the United States and China, which pledges to reduce greenhouse gas (GHG) emissions. [Note: the US media likes to use the sports-derived phrase ‘game-changing’ to refer to significant events.] This is certainly a significant development in the politics of climate change. Indeed, the two countries are the world’s largest emitters of GHGs and until today the two have been engaged in a game of what Paul Harris has called “you go first!” From the looks of it, they have both chosen to ‘go first’.
According to news reports, here are some of the details:
[President] Obama is setting a new target for the U.S., agreeing to cut greenhouse gas emissions to 26 to 28 percent below 2005 levels by 2025. The current U.S. target is to reach a level of 17 percent below 2005 emissions by 2020…
[President] Xi committed China to begin reducing its carbon dioxide emissions, which have risen steadily, by about 2030, with the intention of trying to reach the goal sooner, according to a statement released by the White House.
China, the world’s largest greenhouse-gas emitter, also agreed to increase its non-fossil fuel share of energy production to about 20 percent by 2030, according to the White House.
Is the negotiated agreement ideal? Not nearly. China will still be increasing its total GHG emissions until about 2030. Despite this, however, the deal has been met with some praise from environmental groups for the symbolic significance of the deal, which makes the potential for getting a positive deal agreed in Paris next year more likely.
Jake Schmidt, director of international programs for the Natural Resources Defense Council, a Washington-based environmental group, said no other countries can have as big an impact on the climate debate as the U.S. and China.
“They shape how the market invests,” he said. “They’ve also been two of the most difficult players in the history of the climate negotiations so the fact that they are coming out and saying they are going to take deep commitments will be a powerful signal to the rest of the world.”
Of course, not everyone is happy. Soon-to-be US Senate Majority Leader, Mitch McConnell (R-KY) is outraged:

New Report Claims that British Columbia Has Geo-hermal Energy
The useful DesmogCanada blog has an informative new post up, describing the results of a new report issued by the Canadian Geothermal Energy Association, which claims that there is enough untapped geothermal energy in British Columbia to power the whole province. Although there are some drawbacks to using geothermal power as a dominant energy source, there are many advantages, the most important of which (from an environmental perspective) is that geothermal energy is virtually carbon-free! (For a short demonstration of how geothermal energy is produced and transported, see the video clip below.} From DesmogCanada:
Geothermal power plants provide a firm source of base load power, similar to a hydro dam. Dr. Stephen Grasby, a geochemist with Natural Resources Canada, says the environmental footprint of geothermal energy is smaller than other renewable energy sources, such as wind and hydro.“For instance, the surface area required to have developments like a wind farm, that takes a large surface area and has other associated issues with things like bird kill,” he said. Geothermal energy requires only a well and a heat exchange system.“Drilling is relatively low impact,” he said, adding with a laugh, “worst case scenario is you accidentally discover oil or something.”

According to the CanGEA report, BC has “enormous potential to produce geothermal power,” which makes it shameful that Canada is “currently the only major country located along the Pacific Rim’s Ring of Fire not producing geothermal energy”. Why is this? There are many factors, but the political power of oil and gas interests is certainly an important impediment to constructing a carbon-free, environmentally-sustainable source of energy for our province.

You must be logged in to post a comment.