
The Failed State Index is created and updated by the Fund for Peace. For the most recent year (2013), the Index finds the same cast of “failed” characters as previous years. There is some movement, the “top” 10 has not changed much over the last few years.
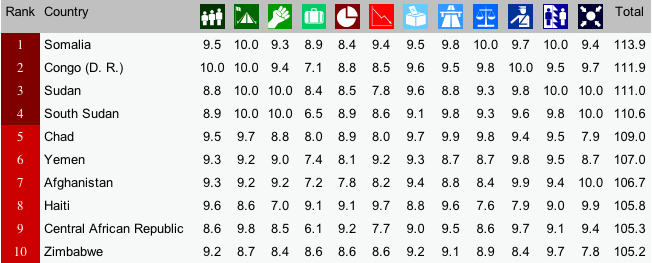
Notice the columns in the image above. Each of these columns is a different indicator of “state-failedness”. If you go to the link above, you can hover over each of the thumbnails to find out what each indicator measures. For, example, the column with what looks like a 3-member family is the score for “Mounting Demographic Pressures”, etc. What is most interesting about the individual indicator scores is how similar they are for each state. In other words, if you know Country X’s score on Mounting Demographic Pressures, you would be able to predict the scores of the other 11 indicators with high accuracy. How high? We’ll just run a simple regression analysis, which we’ll do in IS240 later this semester.
For now, though, I was curious as to how closely each indicator was correlated with the total score. Rather than run regression analyses, I chose (for now) to simply plot the associations. [To be fair, one would want to plot each indicator not against the total but against the total less that indicator, since each indicator comprises a portion (1/12, I suppose) of the total score. In the end, the general results are similar,if not exactly the same.]
So, what does this look like? See the image below (the R code is provided below, for those of you in IS240 who would like to replicate this.)

Here are two questions that you should ponder:
- If you didn’t have the resources and had to choose only one indicator as a measure of “failed-stateness”, which indicator would you choose? Which would you definitely not choose?
- Would you go to the trouble and expense of collecting all of these indicators? Why or why not?
R-code:
install.packages("gdata") #This package must be installed to import .xls file

library(gdata) #If you find error message--"required package missing", it means that you must install the dependent package as well, using the same procedure.

fsi.df<-read.xls("http://ffp.statesindex.org/library/cfsis1301-fsi-spreadsheet178-public-06a.xls")  #importing the data into R, and creating a data frame named fsi.df

pstack.1<-stack(fsi.df[4:15]) #Stacking the indicator variables in a single variable

pstack.df<-data.frame(fsi.df[3],pstack.1) #setting up the data correctly

names(pstack.df)<-c("Total","Score","Indicator") #Changing names of Variables for presentation

install.packages("lattice")  #to be able to create lattice plots

library(lattice) #to load the lattice package

xyplot(pstack.df$Total~pstack.df$Score|pstack.df$Indicator,  groups=pstack.df$Indicator, layout=c(4,3),xlab="FSI Individual Indicator Score", ylab="FSI Index Total")

You must be logged in to post a comment.