Israel and Syria once again Negotiating over Golan Heights

In intro to IR on Wednesday we addressed global environmental issues and we went over this chart outlining Thomas Homer-Dixon’s overview regarding the link between environmental scarcity and security. According to Homer-Dixon, environmental degradation is not only an important economic, social, and health issue, it is crucially an issue of importance for global security.

We see the important link between increased environmental scarcity and social effects (like ethnic conflicts, deprivation conflicts and coups d’etat), facilitated indirectly at times by the conditions of weakened states.

Homer-Dixon argues that these environmentally-driven conflicts will increase the more the environment degrades. Moreover, it is just those places in the world that have the least capacity to deal with the potentially negative effects of environmental degradation whose environments will be most likely to suffer.

In the far left column is “unequal resource access”. One of the most important resources to humankind is water. The conflict between Syria and Israel over the Golan Heights is crucially linked to water. As we learn from the New York Times:

JERUSALEM — Peace overtures between Israel and Syria moved up a gear on Wednesday when a Syrian cabinet minister said that Prime Minister Ehud Olmert of Israel had sent a message to President Bashar al-Assad to the effect that Israel would be willing to withdraw from all the Golan Heights in return for peace with Syria.

The Syrian expatriate affairs minister, Buthaina Shaaban, told Al Jazeera television, “Olmert is ready for peace with Syria on the grounds of international conditions; on the grounds of the return of the Golan Heights in full to Syria.” She said that Turkey had conveyed the message.

Israeli officials did not deny the statement from Damascus but would not confirm it either, offering a more general, positive reaction. “Israel wants peace with Syria; we are interested in a negotiated process,” said Mark Regev, a spokesman for Mr. Olmert. “The Syrians know well our expectations, and we know well their expectations…”

“…Withdrawal from the Golan Heights is a contentious issue in Israel. The territory is a strategic plateau that overlooks a large swath of northern Israel. Israel has objected to past Syrian demands for access to the shore of the Sea of Galilee, a main water source for Israel.
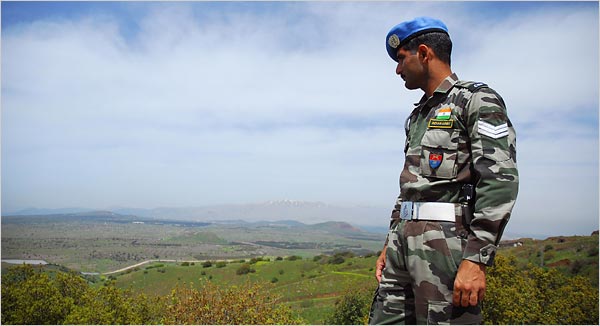
Yehuda Raizner/Agence France-Presse — Getty Images

An Indian member of the United Nations force in the Golan Heights, a strategic

plateau that overlooks a swath of northern Israel.

The Onion on UN Report Declaring China Air Pollution Champion

In their inimitable way, the fine people at the Onion have used a new UN report on air pollution as the source for this satirical report. China is now the world’s worst (or best–I suppose it depends on one’s perspective) air polluter. Some memorable quotes from the Chinese “Ambassador” interviewed in the report:

“The labor of my people have [sic] made the sky black with the smoke of progress. We are overjoyed!”

“The sky over China is now a rainbow of grays reflecting all the shades of our prosperity.”

“Close to one million people will die of cancer in China this year. Cancer is a very modern disease!”

Happy Earth Day

Today is Earth Day, a celebration of our planet and a day to reflect on all that it gives us and all that we do to make it less likely to continue to provide for us into the future. While we are unlikely to be entering a neo-Malthusian period, we are putting an ever increasing strain on the fragile ecosystem. Here, from the Vancouver Sun, are ten things that you can do to make a difference. How many of these are you currently doing? I hereby publicly commit that I will ride my bicycle to work until the end of the semester (that’s only about two weeks from now, but still two weeks is two weeks.)

1. Leave your car at home for a day (or a week or a month) and try walking or biking. If work is too far away to walk, take public transit or carpool. One city bus eliminates the emissions of 40 cars.

2. Turn off the lights, the computer and the television when they are not in use. Using only highly efficient and money-saving appliances can reduce the electricity consumption of an average household to one-10th of the national average.

3. Try eating meat-free at least one day a week. A meat-based diet requires seven times more land than a plant-based diet. Livestock production is responsible for more climate change gasses than all the motor vehicles in the world.

4. Choose foods produced organically, locally and in season. Support your regional farmers and farming industry: buying locally and in season is better for the environment than buying foods that have been shipped hundreds of kilometres to your local market.

5. Put a composter in your backyard or use your green bin to reduce household waste. Composting organics has two key benefits: it reduces the amount of waste going to landfills and when added to your garden, helps nourish soil and plants.

6. Turn off your car’s engine if stopped for more than 10 seconds. If every driver of a light-duty vehicle avoided idling by five minutes a day, collectively, we would save 1.8 million litres of fuel per day, almost 4500 tonnes of GHG emissions.

7. Set your thermostat above room temperature in the summer and below room temperature in the winter. For each degree you adjust, you can save 5% on your utility bill and 1% on your energy use.

8. Replace incandescent light bulbs with compact fluorescent bulbs (CFLs). A CFL uses only 25% as much energy as an incandescent bulb and lasts 10 times longer.

9. The simple act of recycling has more impact on the environment than the average Canadian thinks. The amount of wood and paper North Americans throw away each year is enough to heat five million homes for 200 years.

10. This is a great opportunity to brag. Tell someone what you’re doing to make the world a better place. Support the cause. Encourage them to get involved too.

Source: Earth Day Canada

So What does the Price of Soybeans have to do with Smog in Buenos Aires?

When I was younger, my friend’s father would often respond to our childhood rantings with the question, “but what’s that got to do with the price of tea in China?”  I still don’t really understand what it means, but in this increasingly globalized world, there is a direct causal link bewtween the price of soybeans and smog in the Argentinian capital city of Buenos Aires.  The causal mechanism is outlined in this Bloomberg news report:
April 17 (Bloomberg) — Smoke from fires set by farmers to clear fields for grazing covered the city of Buenos Aires and shut down some highways leading into the Argentine capital.

Interior Minister Florencio Randazzo called the smoke a “disaster” and said 292 separate fires covering 70,000 hectares (173,000 acres) had been detected in the provinces of Buenos Aires and neighboring Entre Rios.

Farmers are burning more land as they create pastures for cattle that previously grazed fields now dedicated to soybeans, said Randazzo.  An 89 percent increase in soybean futures prices in the past year, part of a global explosion in food costs, has prompted Argentine farmers to increase the area sown to the oilseed by 10 percent, according to the Agriculture Secretariat.

“Those responsible are farmers who are burning their meadows to cut costs and maximize profits without considering the consequences,” said Randazzo in a news conference at the Presidential Palace. “We are conducting investigations to find those responsible.”

Notice this chart of soybean prices below and the fact that many farmers are moving into the soybean growing business and I think we could have the potential for an intermediate-term top in the soybean market.  As in many speculative markets, many would-be speculators rush in just at (or even just after) the top has been set for that particularly stock or commodity.  It’s not a surprise the the record number of sales transactions for US real estate occurred in the month (around Summer 2005) as a top was setting in.  If I had to bet, I’d wager that many of those new soybean farmers will wish they had remained cattle farmers.

Watch Video Animations of U.S. Carbon Dioxide Pollution

Here is a video of a graphic representation of C02 emissions over the continental United States.  Here is a description of the video’s contents:

A new, high resolution, interactive map of United States carbon dioxide emissions from fossil fuels has found that the emissions aren’t all where we thought. The maps and system, called Vulcan, show CO2 emissions at more than 100 times more detail than was available before. Until now, data on carbon dioxide emissions were reported, in the best cases, monthly at the level of an entire state grid. The Vulcan model examines CO2 emissions at local levels on an hourly basis. Purdue researchers say the maps are also more accurate than previous data because they are based on greenhouse gas emissions instead of estimates based on population in areas of the United States.

From thedailygreen.com, we find more information about the details of carbon emissions here in the United States:

Just where is all that global warming pollution coming from?

The Northeast pumps out an awful lot of carbon dioxide, but the Southeast, Midwest and Southern California are also responsible for voluminous pollution that billows out each day.

The precise sources of carbon dioxide have now been mapped, with 100-times more detail than was previously available, by Vulcan project researchers at Purdue University.

The high-resolution, interactive maps combines emissions data from power plants, factories and vehicles, and produces maps and movies that compare the relative contribution of pollution from various parts of the country on an hourly basis. One of the most striking things one sees when watching the animations is the day-night “breathing” cycle of our pollution, with a long exhale of pollution all day, followed by a sharp decline each night. Seasonal spikes – such as those when hot days prompt millions of Americans to turn up their air conditioners – are also evident.

Ken Roth Lecture on Human Rights and the Environment

We watched a video of a lecture given by Ken Roth (the Executive Director of the human rights NGO, Human Rights Watch) on the link between human rights and environmental degradation.  You can watch the entire lecture on youtube.  It is also embedded below.  Here is the description of the lecture:

Human Rights Watch Executive Director Ken Roth explains how environmental abuse has led to human rights violations in Darfur, Nigeria, Indonesia and Angola in the first of this season’s Joan B. Kroc Institute for Peace & Justice Distinguished Lecture Series at the University of San Diego. Series: “Joan B. Kroc Institute for Peace & Justice Distinguished Lecture Series” [10/2007]

Economic Growth and Pollution in Budapest

In intro to comparative, in a few weeks time, we’ll cover developments in the post-communist world of Eastern Europe. Here is an interesting report from one of my home towns (I lived and studied in Budapest for a year in the late 1990s) that looks at the effects of economic growth on first lowering and now raising levels of pollution in the majestic Hungarian capital.

budapest.jpg Climb into the Buda Hills and look back at the flatlands of Pest and the pollution is obvious: a yellow-gray cloud that blankets the Hungarian capital much of the time.

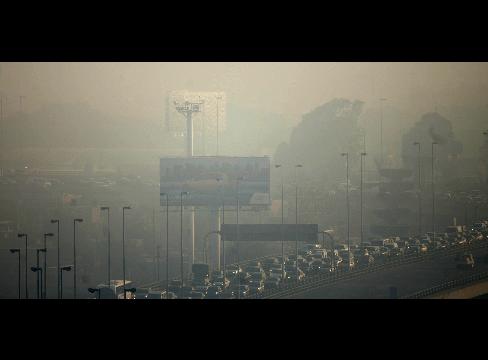
Indeed, 19 years after the collapse of communism, Budapest’s air quality has become a problem again. Pollution exceeded recommended levels 115 days last year, 80 days more than permitted under European Union (EU) guidelines. [of which Hungary is a member.] In late December and early January, the capital experienced one of its most prolonged smog events in a decade.

When communism imploded in 1989, Budapest’s air was atrocious. With their two-cycle engines, fleets of Trabant automobiles spewed black clouds of lead-laden exhaust, while city busses and industrial facilities pumped eye-stinging emissions into the air. During the 1990s the air cleared as factories installed pollution controls, leaded gasoline was banned, and newer, cleaner Western cars replaced dirty Soviet ones.

But in recent years, those gains have been reversed as many Hungarians now drive to work from increasingly far-flung suburban areas. Lead and sulfur dioxide have been replaced by dangerous concentrations of tiny exhaust particles.

“We’ve exchanged [Victorian-era] London-type smog for Los Angles-type smog,” laments Janos Zlinszky of the Regional Environmental Center for Central and Eastern Europe. “The nature of our environmental problems is shifting.”

Across east-central Europe, a region once blighted by Communist-era pollution, economic development is bringing on a new set of environmental problems and, in some cases, bringing back old ones.

CO2 Emissions in China Increasing Faster than Previously Believed

In intro to comparative, we have generally compared spatially across countries (or states). There is a lot of explanatory power, however, that can be achieved by modeling and comparing political phenomena at the sub-national level. Maximilian Auffhammer and Richard Carson–two economists–have done this by modeling the rise in Chinese CO2 emissions, using a panel data set at the provincial level in China. Their data set includes 30 provincial-level entities (or provinces) analyzed between 1985 and 2004. See a post I made on China’s pollution problems and economic growth here. I’ve reproduced a slide show from the post below. Here’s a snippet from their paper, which can be accessed here:

[rockyou id=99737780&w=500&h=350]

The People’s Republic of China (PRC) has long been seen as the key future participant to an effective agreement limiting the adverse impacts of climate change. It is currently the number two emitter of carbon dioxide (CO2) and is about to overtake the United States, who has held this position since 1890, as the leading emitter. Further, the United States has long preconditioned its adherence to any international agreement such as the Kyoto Protocol on China’s formal concurrence that it would also undertake substantial CO2 reductions. Efforts to reach such an agreement failed in the late 1990’s during the Clinton administration and the Bush administration decided not to pursue policies that would allow it to sign the treaty and have it rati¯ed by the U.S. Senate.

This paper presents econometric forecasts that strongly suggest that the short to medium term path of Chinese CO2 emissions has increased by a factor of two or more since that time. Our best forecast has China’s CO2 emissions surpassing the United States before the year 2010 rather than 2020 as previously anticipated (Intergovernmental Panel on Climate Change, 2000; Siddiqi, Streets, Wu and He, 1994; Panayotou, Sachs and Zwane, 2002). Our focus in this paper is on exploring alternative econometric specifications for forecasting China’s CO2 emissions using a rich new panel dataset from 1985 to 2004 at the provincial level. The prediction of a dramatic recent increase in the predicted path of China’s CO2 emissions over the short to medium term horizon is shown to be robust to a wide range of alternative specifications. We show, however, that it is possible to strongly reject both the standard engineering specifications that appear in the Intergovernmental Panel on Climate Change (2000), and the recent Stern Report (2006) as well as the popular environmental Kuznets curve specification. All of the “best” models are dynamic in nature employing some type of lag structure, which is consistent with the nature of an installed durable capital stock.

Human Effects on the World’s Oceans

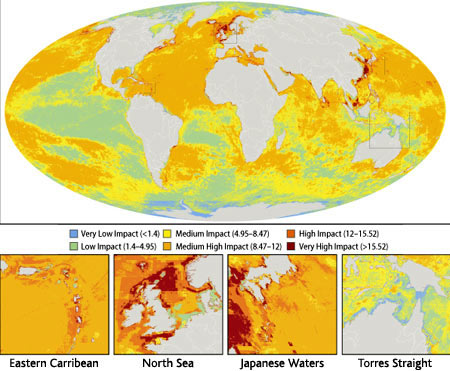
Here is a map that is unlike any of the maps of the world that I’ve posted previously. The obvious difference is that the whole of the world’s land mass is an undifferentiated white. What this map shows is the impact of human beings on (the destruction of) the world’s oceans and seas. From Science Now

ocean_impact_map.jpgFour years in the making, a groundbreaking new map of the state of the world’s oceans was released today, and its message is stark: Human activity has left a mark on nearly every square kilometer of sea, severely compromising ecosystems in more than 40% of waters.

The map, presented here at the annual meeting of the American Association for the Advancement of Science (publisher of ScienceNOW)–and published tomorrow in Science–combines 17 anthropogenic stressors, including coastal runoff and pollution, warming water temperature due to human-induced climate change, oil rigs that damage the sea floor, and five different kinds of fishing. Hundreds of experts worked to weigh and compare the stressors, overlaying them on top of maps that the scientists built of various ecosystems, with data obtained from shipping maps, satellite imagery, and scientific buoys. Then marine scientists modeled how different ecosystems would be affected by the stressors, mapping so-called impact scores onto square-kilometer-sized parcels worldwide. The scores correspond to colored pixels on the new map.

Design a site like this with WordPress.com
Get started