Category: Data
Corruption and Transparency International (Redux)
Apropos of an earlier post and discussion in class today about correlation and causality, here is an excerpt from an interview with Transparency International’s Huguette Labelle, where she answers questions about the apparent correlation between corruption levels and GDP, and corruption levels and levels of violent conflict:
Question:
The countries with the best scores in the CPI seem to be some of the world’s richest countries – is higher GDP the key to less corruption?
Answer:
I think the difference between the countries at the top and the bottom is not so much due to their relative wealth or poverty, but to the development of their institutions. The top scorers have effective public sectors, with open contracting procedures, strong disclosure rules and access to information.
Labelle is implying here that the correlation between corruption and GDP is not causal; it is spurious (we’ll talk about spurious causation next class).
Question:
Many of the countries with the worst scores in the CPI are victims of violent conflict (Somalia, Myanmar, Iraq, Sudan and Afghanistan). What is the relationship between failed states and corruption?
Answer:
In a crisis situation, the institutions of government are weakened, so corruption can more easily take hold and spread. It is not just individuals, but also institutions, that are responsible for maintaining integrity in a country. Many countries at the bottom of the CPI are failed states that are at the intersection of poverty, conflict and corruption.
New York Times special Report on Pollution and Economic Growth in China
You can find a fascinating 10-part report on the dramatic environmental impact of China’s miraculous economic growth in the New York Times. The report, Choking on Growth, provides readers and viewers a multimedia perspective on growth and pollution. From the perspective of comparative politics, it is important to note that some scientists and other scholars in China are trying to estimate the impact of environmental destruction on the general welfare of China’s citizens. They have begun to use a new measure of well-being, “green GDP”, arguing in effect that GDP itself is not an accurate measurement of a society’s well-being. In PLSC240, we will analyze other indicators of well-being, including HDI, the Gini Index, etc, when we study Political Economy (Chapter 4). From an IR perspective, we can ask ourselves what right or responsibility those outside China (whether IGOs like the UN, or other states like Japan and the US) have to intervene and attempt to reverse the damage China is causing to its own and the planet’s fragile ecosystem. Here is a link to a compelling video and some images below from the New York Times:
[rockyou id=99737780&w=500&h=350]
Transparency International Corruption Perceptions Index for 2007
Economists, political scientists and practitioners have long been aware of the deleterious effects of corruption. Transparency International, an international NGO, has been playing a lead role since its inception in 1993 in the fight to highlight the problem of corruption and in creating a forceful international anti-corruption movement. What is corruption?
Corruption is the abuse of entrusted power for private gain. It hurts everyone whose life, livelihood or happiness depends on the integrity of people in a position of authority.
What are some of the effects of corruption, but obvious and hidden?
Corruption hurts everyone, and it harms the poor the most. Sometimes its devastating impact is obvious:
* A father who must do without shoes because his meagre wages are used to pay a bribe to get his child into a supposedly free school.
* The unsuspecting sick person who buys useless counterfeit drugs, putting their health in grave danger.
* A small shop owner whose weekly bribe to the local inspector cuts severely into his modest earnings.
* The family trapped for generations in poverty because a corrupt and autocratic leadership has systematically siphoned off a nation’s riches.
Other times corruption’s impact is less visible:
* The prosperous multinational corporation that secured a contract by buying an unfair advantage in a competitive market through illegal kickbacks to corrupt government officials, at the expense of the honest companies who didn’t.
* Post-disaster donations provided by compassionate people, directly or through their governments, that never reach the victims, callously diverted instead into the bank accounts of criminals.
* The faulty buildings, built to lower safety standards because a bribe passed under the table in the construction process that collapse in an earthquake or hurricane.
Corruption has dire global consequences, trapping millions in poverty and misery and breeding social, economic and political unrest.
Corruption is both a cause of poverty, and a barrier to overcoming it. It is one of the most serious obstacles to reducing poverty.
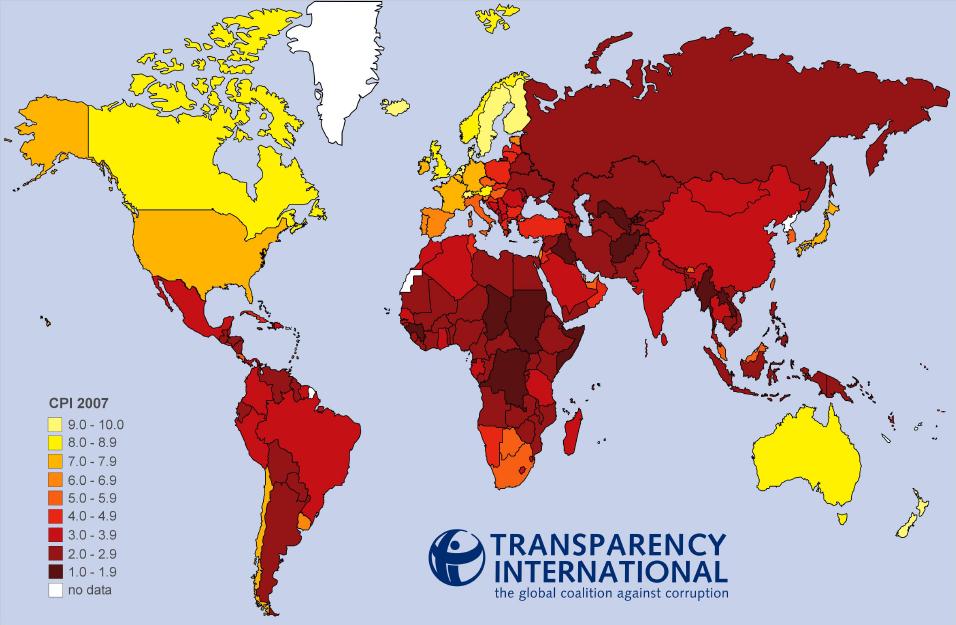
Here is a chart comparing corruption levels around the world in 2007. The higher the cpi score, the higher the level of perceived corruption.
Percentage of the World’s Denizens who Live on Less than $2/day
Using data from the United Nations’ Human Development Index, I put together this table of the thirty states in the world with the highest percentage of residents living on less than two dollars per day. After we have covered (international) political economy later this semester, you’ll know to ask whether the two dollar a day statistic is PPP-adjusted or not. The HDI rank is the Human Development Index rank (out of 177 countries ranked in 2007).
Using Country Watch (you can find a link to it at the course’s page at the library’s website, or click here), we see that Nigeria’s 2006 estimated (ethnic tensions in Africa’s most populous state prevent it from ever completing a census that is acceptable for all interested parties) population is approximately 132 million, meaning that fully 122 million persons in Nigeria survive on less than two dollars per day.
[UPDATE: “A world where some live in comfort and plenty, while half of the human race lives on less than $2 a day, is neither just nor stable. Including all of the world’s poor in a expanding circle of development–and opportunity–is a moral imperative and one of the top priorities of U.S. international policy.”
-President George W. Bush, The National Security Strategy of the U.S.A. 2002]
|
Country |
Below 2$/day (%) |
HDI Rank |
|
Nigeria |
92.4 |
158 |
|
Tanzania (United Republic of) |
89.9 |
159 |
|
Rwanda |
87.8 |
161 |
|
Burundi |
87.6 |
167 |
|
Zambia |
87.2 |
165 |
|
Niger |
85.8 |
174 |
|
Madagascar |
85.1 |
143 |
|
Bangladesh |
84 |
140 |
|
Central African Republic |
84 |
171 |
|
Zimbabwe |
83 |
151 |
|
Gambia |
82.9 |
155 |
|
India |
80.4 |
128 |
|
Nicaragua |
79.9 |
110 |
|
Ghana |
78.5 |
135 |
|
Haiti |
78 |
146 |
|
Swaziland |
77.8 |
141 |
|
Ethiopia |
77.8 |
169 |
|
Cambodia |
77.7 |
131 |
|
Sierra Leone |
74.5 |
177 |
|
Lao P.D.R. |
74.1 |
130 |
|
Mozambique |
74.1 |
172 |
|
Benin |
73.7 |
163 |
|
Pakistan |
73.6 |
136 |
|
Mali |
72.1 |
173 |
|
Burkina Faso |
71.8 |
176 |
|
Nepal |
68.5 |
142 |
|
Mauritania |
63.1 |
137 |
|
Malawi |
62.9 |
164 |
|
Kenya |
58.3 |
148 |
Data Sources on Development, Poverty, Economics, Environment, etc.
For your edification, but also to help you with your assignments, papers, and blogs, here are some data sources that will allow you to compare levels of development and poverty across the globe. The United Nations Development Programme’s Human Development Report is an excellent source of information on indicators related to development. Click here if you would like to look up data and/or statistics. You can search for statistics by country, indicator, or table.
Another excellent data source is the World Bank Development Indicators collected by the World Bank. This link provides access to the Education, Gender, Health & Nutrition & Population, and Poverty databases as well as Country Statistical Information, and Development Gateway Data and Statistics.
Finally, the United Nations maintains a statistical division, whose website can be found here, and which collects a wide range of data from social and demographic statistics, through economic, environmental and energy statistics, to statistics related to Millennium goal indicators.
Constitutions of the World–Source/Archive
Here is a great source of political constitutions from states around the world, provided to the public by the University of Richmond Law School.
From the website:
This database offers constitutions, charters, amendments, and other related documents. Nations of the world are linked to their constitutional text posted somewhere on the Internet.
Kenya, ethnic diversity, and fractionalization scores
Had you taken my Introduction to Comparative Politics class in the fall of 2007, you would have been faced with writing a paper in response to this:
There is much debate regarding the determinants of, and obstacles to, democratization. Are states that rely on natural resources for a large share of their GDP less likely to become and remain democratic? Does ethnic diversity present an obstacle to the democratization and democratic consolidation of a regime? Your term paper will answer one of these two questions either in the affirmative or the negative.
In addition to making the theoretical argument, students were asked to use Iraq and one other state to illustrate and support their argument(s). A few students chose to write on Kenya. I hope they go back and read their papers in light of the current situation in that multi-ethnic state.
Is Kenya ethnically diverse? How can we measure ethnic (or religious, or linguistic) diversity? There is a formula called the fractionalization index, which essentially gives us an idea of how diverse a state is. You can find a table–in Appendix A (which I have excerpted here) of over 100 states around the world with their corresponding fractionalization scores (in three categories), in this National Bureau of Economic Research (NBER) paper by Alesina et al. here The higher the value the higher the level of diversity. Notice the relatively low diversity of states like Poland and Norway and the high amount of diversity of almost all African states. Which is the best way to measure “diversity”? Ethnically? Linguistically? By religion?
|
Country
|
Date (Ethnicity Data)
|
Ethnic
|
Language
|
Religion
|
| Afghanistan |
1995
|
0.7693
|
0.6141
|
0.2717
|
| Canada |
1991
|
0.7124
|
0.5772
|
0.6958
|
| China |
1990
|
0.1538
|
0.1327
|
0.6643
|
| Croatia |
1991
|
0.3690
|
0.0763
|
0.4447
|
| Kenya |
2001
|
0.8588
|
0.8860
|
0.7765
|
| Malawi |
1998
|
0.6744
|
0.6023
|
0.8192
|
| Mozambique |
1983
|
0.6932
|
0.8125
|
0.6759
|
| Nigeria |
1983
|
0.8505
|
0.8503
|
0.7421
|
| Norway |
1998
|
0.0586
|
0.0673
|
0.2048
|
| Portugal |
1998
|
0.0468
|
0.0198
|
0.1438
|
| USA |
2000
|
0.4901
|
0.2514
|
0.8241
|
Pew Global Attitudes Project
In the past, while talking with students, listening to discussion in class or grading papers, I’ve often heard unsubstantiated claims such as “the world is not with President Bush”, or “even the Europeans hate us”, etc. Noting that these claims are unsubstantiated does not mean they are not true. What it does mean is that I need further proof of the veracity of the claims than simply the student’s recitation of that claim. Similarly, you should be skeptical in class if I try to claim something without providing evidence to support that claim. With respect to statements such as the ones I referenced above, the Pew Global Attitudes Project is a fantastic resource. This organization polls publics around the world on a host of issues related to international politics, international affairs, and the domestic ramifications of international events and issues.
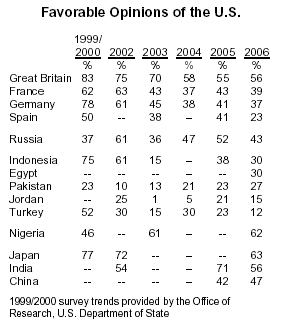
So just how do people around the world view the United States, and how has that opinion changed since 2000? Well, look no further than this report here:

Now, if a student were to write, according to widely available survey evidence, Europeans (at least in Great Britain, France, Spain, and Germany) hold a much less favorable view of the US in 2006 than they did in 2000 (Pew Global 2006), then that would be more compelling.
Globalization, Economic Development and Indentured Servitude
We will be addressing the topic of globalization later in the semester and will be viewing this video on the use of what amounts to slave labor in the silk industry in India.
I found this on the Human Trafficking and Modern-day Slavery website.
Human Trafficking Website 2007-2008. Country by country reports of human trafficking, modern day slavery, contemporary slavery, debt bondage, serfdom, forced labor, forced marriage, transferring of wives, inheritance of wives, and transfer of a child for purposes of exploitation.
You must be logged in to post a comment.