
We spent much of last Friday’s session understanding various realist approaches to international relations and the importance therein of concepts like anarchy, survival, power and war. Here’s a clear–and highly original–attempt to demonstrate the history of world warfare since WWII. For a menu of the foods and which countries they are meant to represent, click here. Before doing so, which foods do you think represent Great Britain, Germany, France, China, and the United States, respectively? You can view the film here.
Category: Teaching
Mingst and Snyder–Chapter 3 Reading Questions
Morgenthau, Hans–“A Realist Theory of International Politics”
- Does Morgenthau’s explanation of realist theory focus on any of the levels of analysis in particular? Explain.
- Morgenthau writes “political realism is aware of the moral significance of political action. It is also aware of the ineluctable tension between the moral command and the requirements of successful political action.” What does he mean by this and why is this important for international relations?
- How does Morgenthau define political power, and how is it used in internaitonal politics?
Continue reading “Mingst and Snyder–Chapter 3 Reading Questions”
Modeling Social Processes–Abortion in Cross-national Comparison
Thanks to a post by Zoe and Geoff, I decided to use the social fact of variation in abortion rates from country to country as the inspiration for class discussion today on the modeling process in social sciences. First, the data* (listing only the top and bottom 10–the US is 30th (out of 90 countries with data available) with a rate of 23.9% in 2003):
|
Country |
Year |
% |
|
Russia |
2005 |
52.5 |
|
Greenland |
2004 |
50.2 |
|
Bosnia and Herzegovina |
1988 |
48.9 |
|
Estonia |
2004 |
47.4 |
|
Romania |
2004 |
46.9 |
|
Belarus |
2004 |
44.6 |
|
Hungary |
2004 |
42.0 |
|
Guadeloupe |
2005 |
41.4 |
|
Ukraine |
2004 |
40.4 |
|
Bulgaria |
2004 |
40.3 |
|
… |
|
|
|
… |
|
|
|
Suriname |
1994 |
3.0 |
|
Puerto Rico |
2001 |
2.2 |
|
Malta |
2004 |
1.7 |
|
Qatar |
2004 |
1.3 |
|
Portugal |
2005 |
0.8 |
|
Venezuela |
1968 |
0.8 |
|
Mexico |
2003 |
0.2 |
|
Poland |
2004 |
0.06 |
|
Panama |
2000 |
0.02 |
|
Chile |
1991 |
0.02 |
Now, according to Lave and March, the next step in the model-building process is to consider a social process that would lead to this outcome. There were three potential answers given in class, which correspond to three categories of explanation that we will address throughout the course:
1) Cultural–it would seem that religion is very important to individuals in the countries with the lowest rates. Most of these countries are strongly Catholic and the Church’s official policies are strongly anti-abortion (pro-life). Thus, individuals in these societies are inculcated with a strong view of what to do in the case of an unwanted pregnancy.
2) Rational Choice–one of the groups argued that the decision to abort (or not) a fetus was made on the basis of strategic calculations of self-interest. The countries at the bottom, these students argued, were agricultural and poorer, and children are needed as a source of labor for the household, as a future hedge against retirement for parents who live in societies with a poorly developed social welfare state, with little hope of receiving retirement funds from the government.
3) Institutional–rules, laws, regulations. Some students argued that some countries (like Chile) have laws making abortion illegal, thus either lowering the number overall, or decreasing the incentive for those having illegal abortions to report them to the official authorities.
That was great work; give yourselves a pat on the back or a round of applause.
The third step in the modeling process is, then, to tease out further implications of your preferred hypothesis above. Let’s go back to the cultural explanation. If it’s true that the Catholic Church has a tremendous impact on people’s views of what is right and wrong then, as one student asked, “wouldn’t it also be the case that divorce levels in these countries should be lower than divorce levels in the countries at the top of the list (since the Catholic Church also frowns upon divorce) ?
Continue reading “Modeling Social Processes–Abortion in Cross-national Comparison”
Blog Assignment–PLSC 250-Introduction to International Relations
The function of your blog will be to select, research, analyze, and contribute knowledge and information on a topic of interest to you (the group will select one topic only) in international relations. As we address the theories and principles of international relations over the course of the semester, you will post to your blog analyzing how these theories, principles, and ideas apply to your chosen topic. The goal is for your group to learn more about that topic than we could ever hope to cover in class over the course of a single semester. You will have to post your topic of choice, and a brief description of the topic, by midnight, Sunday, January 27th.
There is a myriad of topics in international relations that may be of interest to you. To help you begin to narrow down your choice of topic, go to the index of Mingst’s Essentials, and browse the list of entries.
Continue reading “Blog Assignment–PLSC 250-Introduction to International Relations”
Links to Student Blogs in PLSC240-03
Here is where I would like you to leave information about your blog. Please click and a comment giving the rest of us the information necessary to add your blog to our blogroll.Blog name:URL: leave out the “www”The First Initial and last name of the blog partners.
_PLSC240-03-blogname
M. Student and K. Student
Kenya, ethnic diversity, and fractionalization scores
Had you taken my Introduction to Comparative Politics class in the fall of 2007, you would have been faced with writing a paper in response to this:
There is much debate regarding the determinants of, and obstacles to, democratization. Are states that rely on natural resources for a large share of their GDP less likely to become and remain democratic? Does ethnic diversity present an obstacle to the democratization and democratic consolidation of a regime? Your term paper will answer one of these two questions either in the affirmative or the negative.
In addition to making the theoretical argument, students were asked to use Iraq and one other state to illustrate and support their argument(s). A few students chose to write on Kenya. I hope they go back and read their papers in light of the current situation in that multi-ethnic state.
Is Kenya ethnically diverse? How can we measure ethnic (or religious, or linguistic) diversity? There is a formula called the fractionalization index, which essentially gives us an idea of how diverse a state is. You can find a table–in Appendix A (which I have excerpted here) of over 100 states around the world with their corresponding fractionalization scores (in three categories), in this National Bureau of Economic Research (NBER) paper by Alesina et al. here The higher the value the higher the level of diversity. Notice the relatively low diversity of states like Poland and Norway and the high amount of diversity of almost all African states. Which is the best way to measure “diversity”? Ethnically? Linguistically? By religion?
|
Country
|
Date (Ethnicity Data)
|
Ethnic
|
Language
|
Religion
|
| Afghanistan |
1995
|
0.7693
|
0.6141
|
0.2717
|
| Canada |
1991
|
0.7124
|
0.5772
|
0.6958
|
| China |
1990
|
0.1538
|
0.1327
|
0.6643
|
| Croatia |
1991
|
0.3690
|
0.0763
|
0.4447
|
| Kenya |
2001
|
0.8588
|
0.8860
|
0.7765
|
| Malawi |
1998
|
0.6744
|
0.6023
|
0.8192
|
| Mozambique |
1983
|
0.6932
|
0.8125
|
0.6759
|
| Nigeria |
1983
|
0.8505
|
0.8503
|
0.7421
|
| Norway |
1998
|
0.0586
|
0.0673
|
0.2048
|
| Portugal |
1998
|
0.0468
|
0.0198
|
0.1438
|
| USA |
2000
|
0.4901
|
0.2514
|
0.8241
|
Links to Student Blogs in PLSC250–Section 03
Here is where I would like you to leave information about your blog. Please click and a comment giving the rest of us the information necessary to add your blog to our blogroll.Blog name:URL: leave out the “www”The First Initial and last name of the blog partners.
_PLSC250-03-blogname
M. Student and K. Student
Links to Student Blogs in PLSC250–Section 01
Here is where I would like you to leave information about your blog. Please click and a comment giving the rest of us the information necessary to add your blog to our blogroll.
Blog name:
URL: leave out the “www”
The First Initial and last name of the blog partners.
_PLSC250-01-blogname
M. Student and K. Student
Pew Global Attitudes Project
In the past, while talking with students, listening to discussion in class or grading papers, I’ve often heard unsubstantiated claims such as “the world is not with President Bush”, or “even the Europeans hate us”, etc. Noting that these claims are unsubstantiated does not mean they are not true. What it does mean is that I need further proof of the veracity of the claims than simply the student’s recitation of that claim. Similarly, you should be skeptical in class if I try to claim something without providing evidence to support that claim. With respect to statements such as the ones I referenced above, the Pew Global Attitudes Project is a fantastic resource. This organization polls publics around the world on a host of issues related to international politics, international affairs, and the domestic ramifications of international events and issues.
So just how do people around the world view the United States, and how has that opinion changed since 2000? Well, look no further than this report here:


Now, if a student were to write, according to widely available survey evidence, Europeans (at least in Great Britain, France, Spain, and Germany) hold a much less favorable view of the US in 2006 than they did in 2000 (Pew Global 2006), then that would be more compelling.
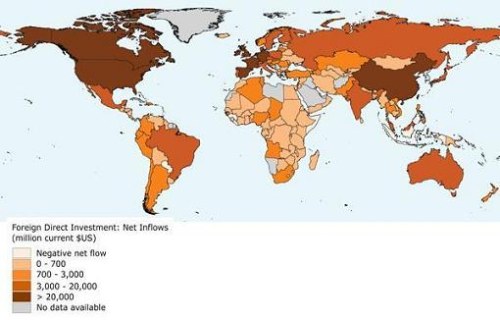
Foreign Direct Investment(FDI)–an Indicator of Globalization
As we will see, globalization is a word (and phenomenon) that is analogous to a Rorschach test in that everyone seems to have his, or her, own slightly unique definition of what it actually means. There is wide agreement, however, that an important characteristic of contemporary globalization is the level of economic integration internationally. One such component of that integration is foreign direct investment (FDI). From the World Resources Institute, here is a map that shows the differing levels of FDI around the globe. The patterns should, by now, be exceedingly familiar.

Here is the map description:
Foreign direct investment data do not give a complete picture of international investment in an economy. Balance of payments data on foreign direct investment do not include capital raised locally, which has become an important source of financing for investment projects in some developing countries. In addition, foreign direct investment data capture only cross-border investment flows involving equity participation and thus omit nonequity cross-border transactions such as intrafirm flows of goods and services. For a detailed discussion of the data issues see the World Bank’s World Debt Tables 1993-1994 (volume 1, chapter 3). Also, cross-country comparisons may not be accurate, because of differences in the definition of what constitutes foreign direct investment.
Source: World Bank Group. 2004, World Development Indicators Online. Washington, DC:World Bank.
Available On-line at: Source Link

You must be logged in to post a comment.