Social Impact and the Decision to Vote

In continuing with today’s theme of the impact of the “social” in political science, we note that political parties the world over have spent a lot of money and developed various ideas and hypotheses regarding what motivates voters to go to the polls and exercise their most basic democratic right. In the most recent issue (which is behind a pay wall) of the American Political Science Review–the flagship journal of the American Political Science Association–a group of political scientists, led by Donald Green at Yale, has demonstrated that social shaming may be a way to increase overall voter turnout.* Here is the abstract, with a sample of the letters sent below:

Voter turnout theories based on rational self-interested behavior generally fail to predict significant turnout unless they account for the utility that citizens receive from performing their civic duty. We distinguish between two aspects of this type of utility, intrinsic satisfaction from behaving in accordance with a norm and extrinsic incentives to comply, and test the effects of priming intrinsic motives and applying varying degrees of extrinsic pressure. A large-scale field experiment involving several hundred thousand registered voters used a series of mailings to gauge these effects. Substantially higher turnout was observed among those who received mailings promising to publicize their turnout to their household or their neighbors. These findings demonstrate the profound importance of social pressure as an inducement to political participation.

Would you be susceptible to being shamed into voting? Well, the authors find that the overall impact of threatening to publicize your (non)-voting behavior to your neighbors was to increase turnout by 8.1 percentage points. That’s an astounding impact. Here are the letters:

social_pressure_vote.jpg

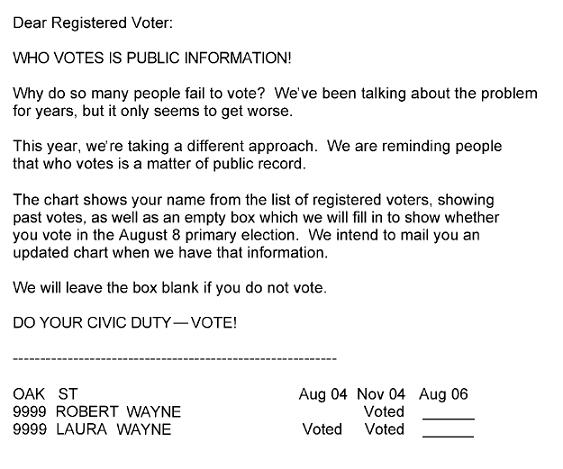
This letter increased the rate of voter turnout by 4.9 percentage points, a much stronger effect than appeals to civic duty alone (which raised turnout from between 1.8 and 2.5 percentage points.

social_pressure_vote2.jpg

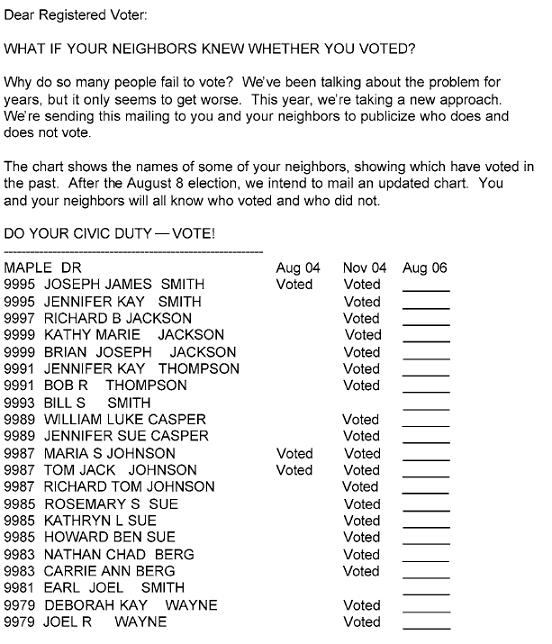
This is the letter that produced an 8.1 percentage point increase in voter turnout.

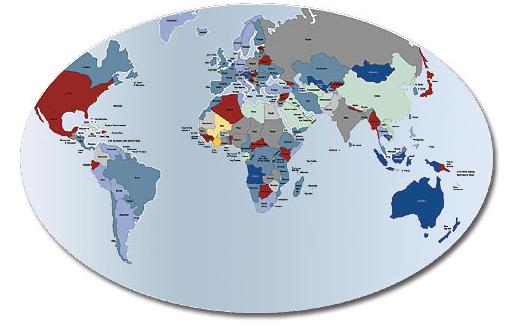
*For a web site that tracks voter turnout rates worldwide, please see this post.

Voter Turnout Across the World

O’Neil (in Chapter 6) argues that democracies are institutionalized through the institutions of participation, competition, and liberty.  The most common form of participation in democracies is voting in elections.  Yet, the general sense seems to be that voters are turning out to vote in ever smaller numbers over the years.  Do the data bear that out?

The IGO IDEA–The International Institute for Democracy and Electoral Assistance–has a fantastic website dedicated to, amongst other things, tracking voter turnout levels in elections around the world. Referring to the map below, we see that voter turnout levels differ from country to country. Why might this be the case? This observation could be used as the first step in demonstrating Lave and March’s four-step process of modeling social and political phenomena. Thus, step one (“observe a social fact”) is voter turnout levels are higher in some countries and lower in others. Step two, then, requires us to consider a social process that could have accounted for this variation in outcomes. Can you think of a social process that can account for the findings on the map below?

world_voter_turnout1.jpg

Here are some important findings from IDEA’s report on world voter turnout trends.  For a complete list of data for each respective country, go here.

  • High turnout is not solely the property of established democracies in the West. Of the top 10 countries in the 1990s only three were Western European democracies.
  • Turnout across the globe rose steadily between 1945 and 1990 – increasing from 61% in the 1940s to 68% in the 1980s. But post-1990 the average has dipped back to 64%.
  • Since 1945 Western Europe has maintained the highest average turnout (77%), and Latin America the lowest (53%), but turnout need not necessarily reflect regional wealth. North America and the Caribbean have the third lowest turnout rate, while Oceania and the former Soviet states of the Commonwealth of Independent States (CIS) and Central Eastern Europe are respectively second and third highest in the regional league table over this period.
  • The overall average turnout in the post-war period for established democracies is 73%, which contrasts with an average of 58% for all other countries. However, turnout rates in both established and non-established democracies have been converging over time.
  • Out of the 81 countries which had first and subsequent elections between 1945 and 1997, the average turnout in first elections (61%) is actually lower than the average for subsequent elections (62%). This represents a mixed pattern backed up by the fact that turnout in 41 countries dropped between the first and second elections but turnout actually rose in another 40 countries.