
Here is a great link to information about the German electoral and political party system. You can find all sorts of information and links (to youtube videos even!) related to German political parties and the electoral system. Here are a couple of images from the link above:
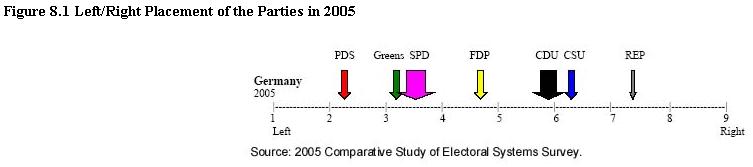
The first is a one-dimensional left-right placement of political parties. Remember that given our relatively small class size, you will be a representative of only one of four parties–CDU/CSU, FDP, SPD, Green Party. [Update: I notice that they have the CDU and CSU listed as separate parties, which they technically are. As I noted in the assignment instructions, the CSU is essentially the CDU, but in Bavaria. They always forms coalitions in the Bundestag when deciding on government formation.]
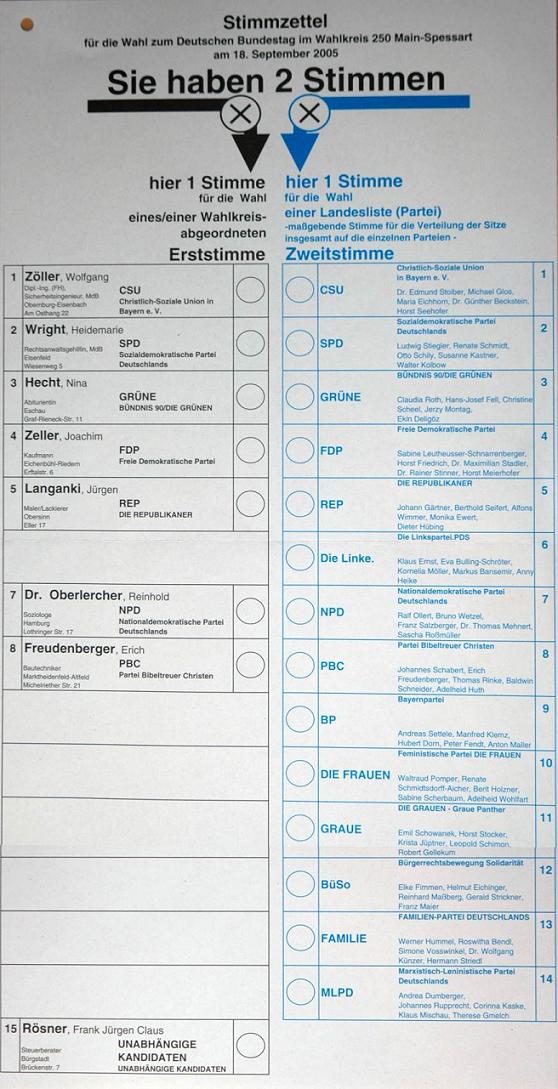
The second image is the unique two-vote electoral ballot; remember that Germans get to vote twice–once for a candidate to fill one of the 299 single-member districts, and once for a party list in a multi-member district. You’ll notice the left side of the ballot has the individual candidate’s name prominently displayed, whereas the party-list side (the right-side of the ballot) has the party name prominently displayed.
Here’s a nice breakdown of the characteristics of demographic support for each of the parties during the 2005 Bundestag elections, the result of which was a “grand coalition” between Angela Merkel’s CDU/CSU (Merkel was voted in by parliament as the Chancellor) and Gerhard Schroeder’s SPD.


This is because all of the German parties are national (in that they run candidates in almost all (if not all) SMDs and all the Lander. Since the western part of Germany has about 80% of the population, each national party will get about that much of its total vote share from the West. The only exception, is the former East German communist party, which is much stronger comparatively in the East (i.e. at 47%, they are performing about 2.5 times better than the relative population differences would predict).
in looking at Table 8.3, why arent there any parties that had more support from eastern regions? Is this just a measurment showing a denser population in the west?