
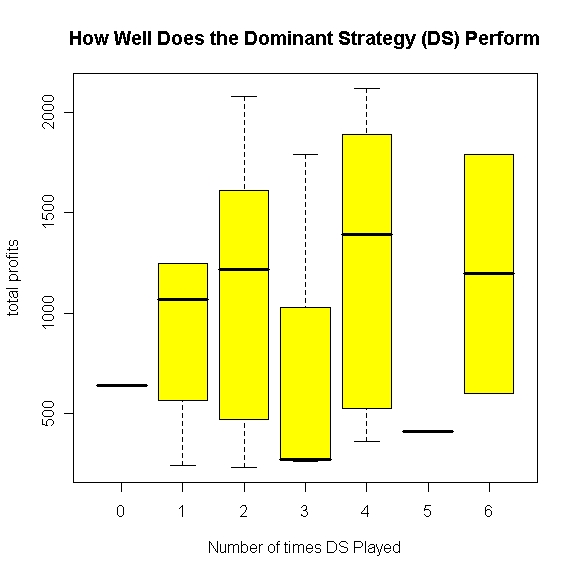
As you’ll see in lecture tomorrow, instrumentally rational players will also choose to “defect” in a priosoner’s dilemma type situation even though they could be much better off absolutely if they and their opponents could learn to cooperate. The chart below has been created using data from the simulation of yesterday. What is take-home message from the chart? Why is the relationship between the phenomena displayed not completely linear? Think about the nature (i.e., the specific rules) of the oil game we played yesterday. (The plot below is a box plot, which is a way of summarizing the means, range, and certain percentiles of the values of a single variable based on another variable.)
