
The inspiration (so to speak) for this latest instalment of my Data Visualization series is a meme that I have been seeing spread across social media in the wake of the recent US Presidential Election. The meme, in essence, notes that numer of US counties (there are over 3000) that were “won” by the incumbent, Donald J. Trump. Indeed, it seems as though the challenger, Joe Biden, ironically won the most votes of any US Presidential candidate in US history while simultaneously having “won” the lowest percentage of counties (about 17%) of any winner of the Presidency ever.
Why did I place “won” in quotation marks? Two reasons: first, I am assuming that the authors of this meme suggest that Trump “won” these counties by having won (at least) a plurality of the vote in each. Which, I suppose, is true. The more important reason that I put “won” in quotation marks above is because US counties are effectively meaningless when it comes to determining who wins the US Presidency. They are only important insofar as receiving more votes than one’s opponent in any individual county helps increase the odds of winning what is important–a plurality of the vote in any individual state (or in Congressional Districts in the cases of Nebraska and Maine). Counties have no official weight when determining electoral college votes, and it doesn’t matter how many counties a candidate wins, as long as they reach at least 270 electoral votes. Counties in the USA vary in population from fewer than 100 (Kalawao County in Hawaii) to over 10,000,000 (Los Angeles County in California). So, discussing who “won” more counties is essentially meaningless.
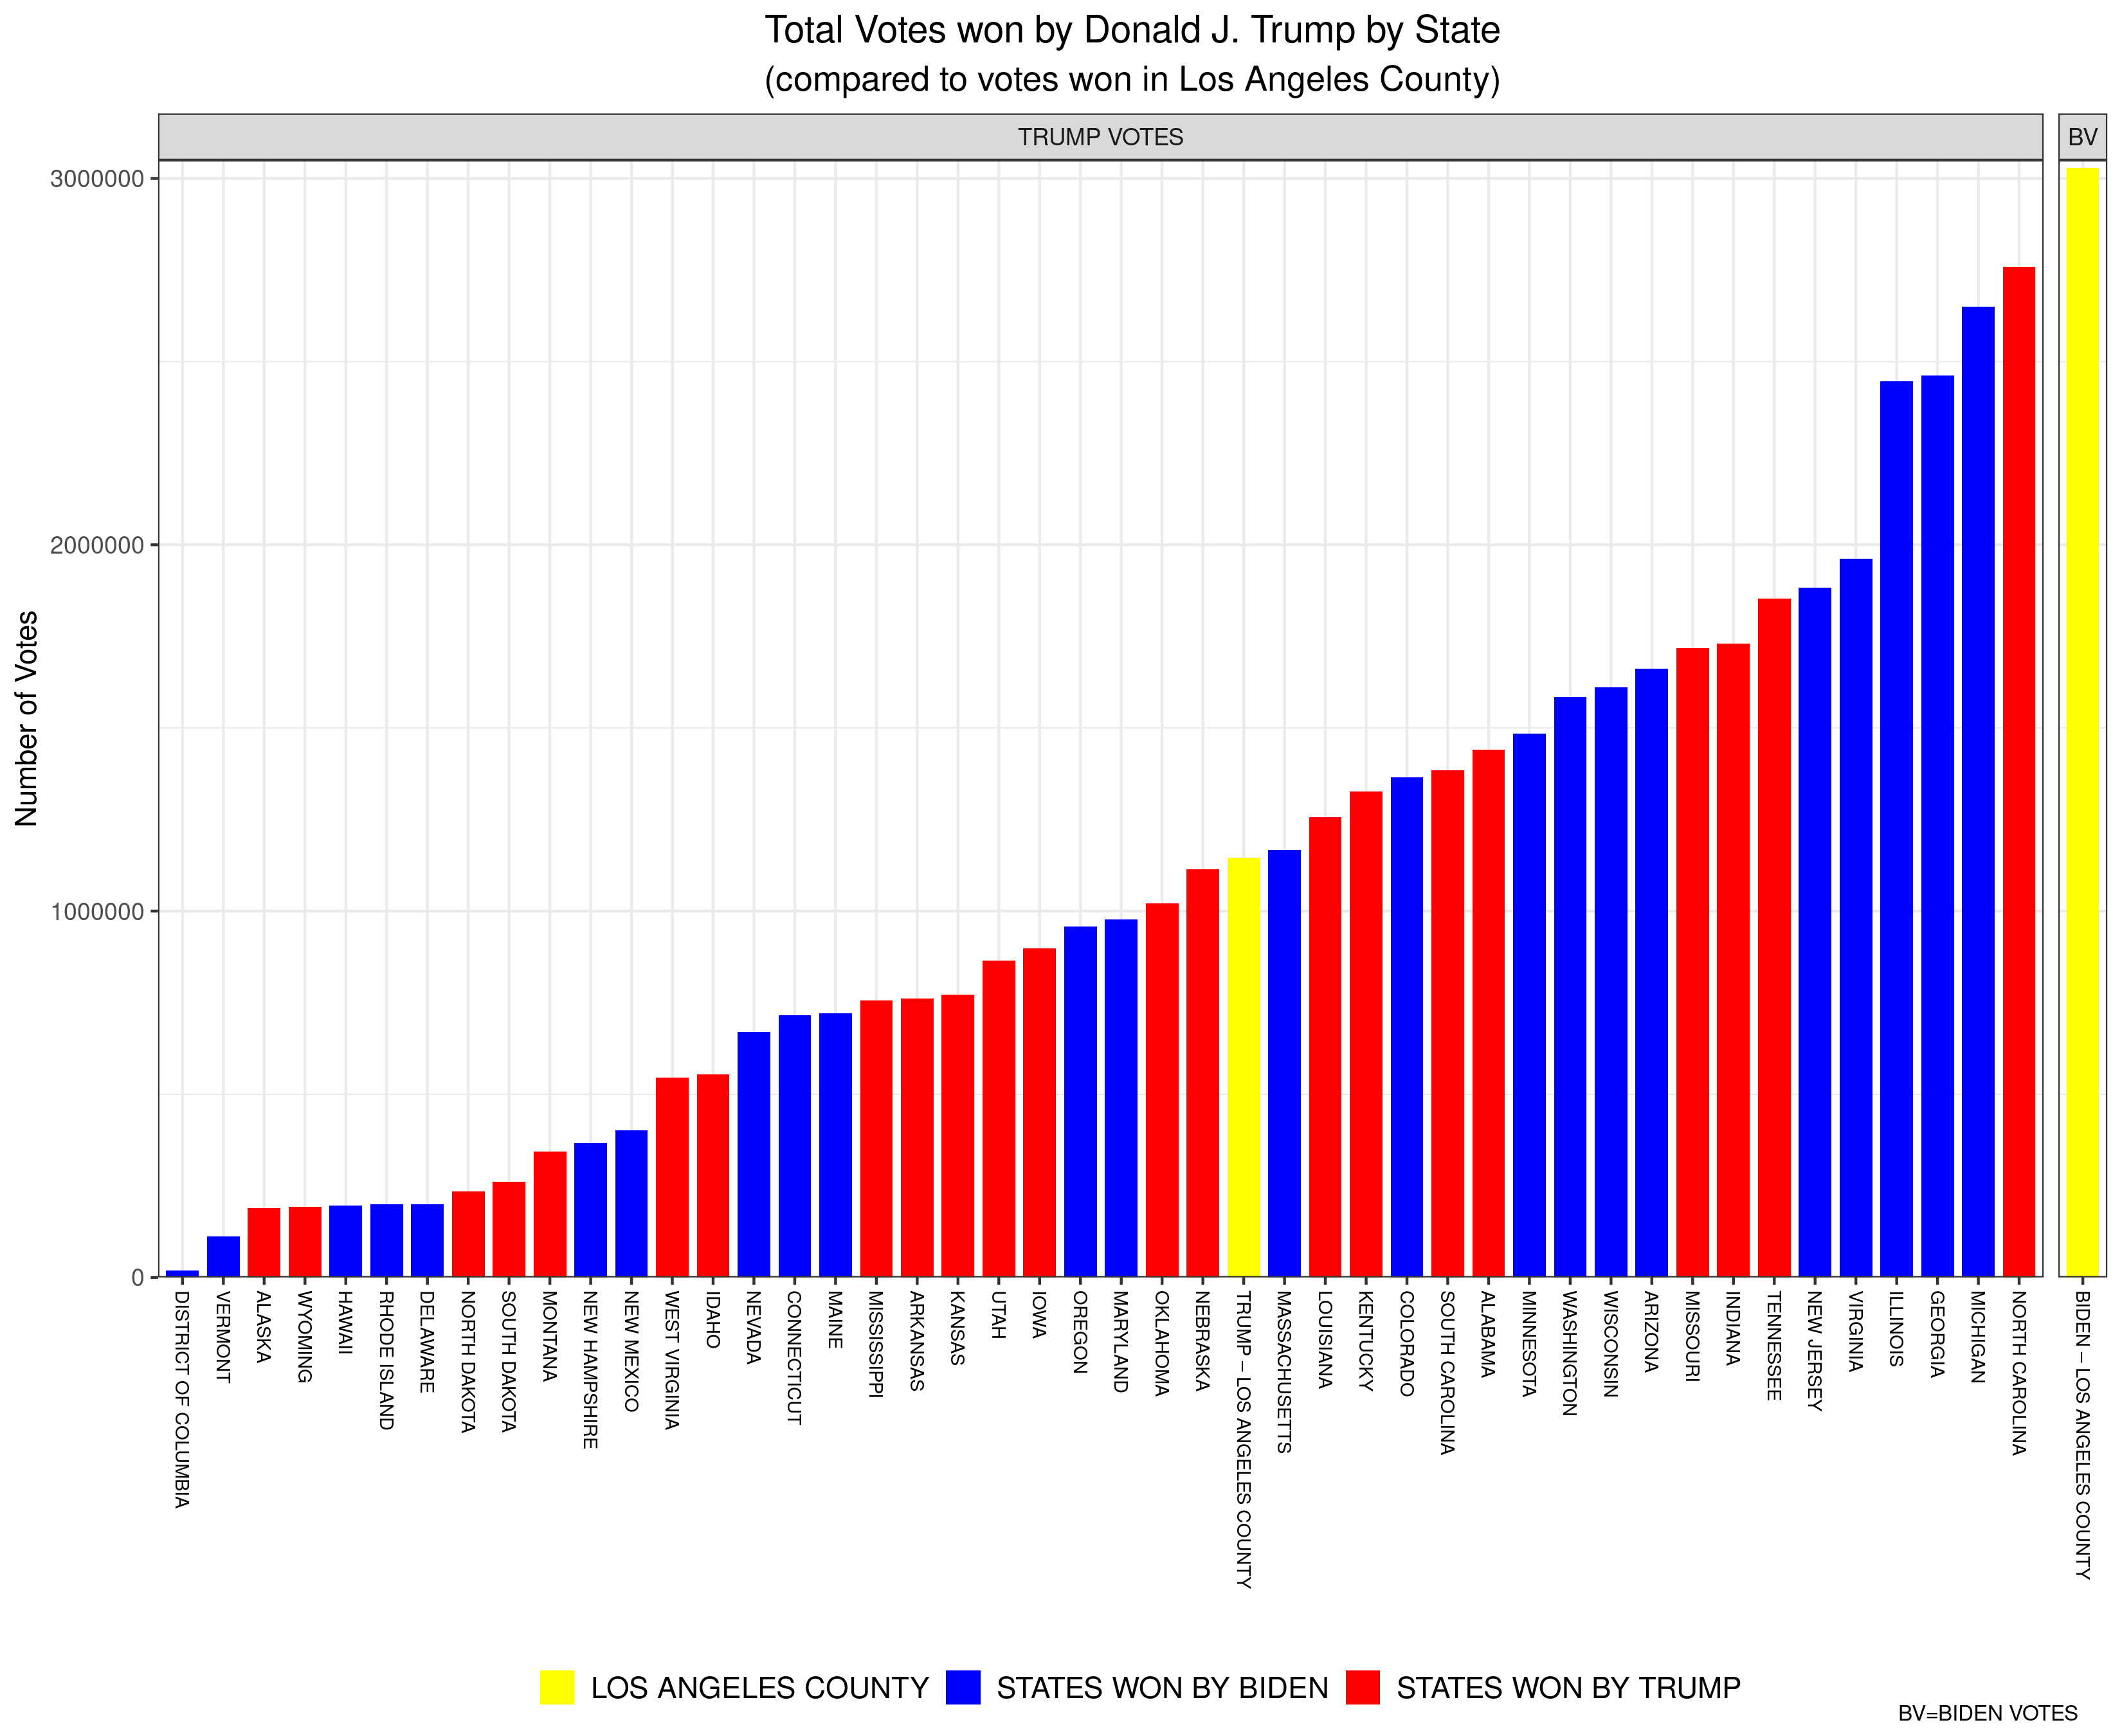
Here’s an example of how absurd referring to counties won becomes. The aforementioned Los Angeles County is a county that Joe Biden handily “won” in November, by a margin of 72.5% to 27.5% for Donald Trump. In short, Trump was walloped by Biden in LA County. Yet, when you compare Trump’s vote in LA County (about 1.15 million) to his total vote in all of the states (and DC) it might shock you to learn that Trump won more votes in LA County than he won in 25 individual states (and in DC). For example, Trump won more total votes in LA County (which, remember, he lost 72.5%-27.5%) than he won in the state of Oklahoma, where he won all 6 Electoral College votes. Moreover, Biden won more votes in LA County alone than Donald Trump won in each of all but three states–Florida, Texas, and Ohio. To be clear, for example, Biden won more total votes in LA County (which, alone, didn’t win him a single Electoral College vote) than Trump won in North Carolina (for which Trump won 15 Electoral College votes).
Here is a bar plot that I’ve created to visualize these data (click on the image to open a larger version). The yellow bar at the far-right represents the number of votes won by Biden in LA County (just over 3 million). The other yellow bar represents the votes won by Trump in LA Country (just over 1 million). Every other bar is the number of votes won by Trump in each of the states (and DC) listed below (Texas, Ohio, and Florida are missing because Trump won more votes in each of those states than Biden won in LA County). The red bars are states won by Trump, while the blue bars represent states won by Biden. Remember, each of the bars (except for the one on the far-right) represent the number of votes Donald Trump won in that state (and LA County).

You must be logged in to post a comment.